
A component supplier needs to know which devices will be built, what each design contains and whether it has an approved place in that design. Headline device shipments leave those questions open. A premium model can carry more memory or a different radio configuration, while a channel inventory correction can reduce production before consumers stop buying.
This article develops a supplier forecast from the device programme and its bill of materials, then reconciles inventory, source allocation and production timing. It uses issuer and market-definition evidence available through 2025. The worked example illustrates the method rather than a named supplier's outlook.
Identify the device event and channel boundary
Write the shipment definition before using a series in a model. The IDC smartphone market share page distinguishes company shipments and market-share calculations from other industry measures. Its published tables identify a period, a global total, and branded-device comparisons; they are not a count of every component purchased during that period. A shipment can mean an OEM's sell-in to a distributor, a distributor's sell-through to a retailer, or a research firm's estimate of new branded devices.
Record these fields in the source ledger:
- Device scope: smartphone, tablet, notebook, server, wearable, module, or another finished unit.
- Unit boundary: branded shipment, factory production, channel sell-in, retail sell-through, activation, or installed stock.
- Period: month, quarter, fiscal year, and the date when the observation is published.
- Geography: global, regional, country, or a route-to-market territory.
- Condition: new, refurbished, replacement, or unknown.
- Counting party: research provider, OEM, contract manufacturer, distributor, or component supplier.
An analyst can use an IDC shipment series to frame device momentum while keeping its scope intact. The series does not prove that every supplier ordered one bill of materials for every unit, that channel inventory cleared, or that a component's revenue moved in the same quarter. Those are separate questions that require separate evidence.
Separate sell-in from sell-through
Sell-in and sell-through are two views of a channel, not two tranches of demand to add together. An OEM can ship phones to a distributor while the retailer still holds prior inventory. If the distributor later sells those phones to consumers, the same physical units appear in both events. A temporary sell-in increase can therefore coexist with weak sell-through and a later production pause.
Use a simple channel bridge: opening channel inventory plus OEM sell-in minus retail sell-through equals closing channel inventory, subject to returns, transfers, and definition changes. If one term is estimated, label it. If a source gives only sell-in, do not describe the result as consumer demand. If it gives only sell-through, do not infer a factory build without a production or procurement link.
Apple's 2025 Form 10-K describes direct and indirect routes, including retail, online, direct sales, and third-party resellers, as well as products and services sold around its devices. That disclosure illustrates why a finished-device shipment is only one point in a multi-route commercial system. A component study should state which route the evidence covers and avoid treating channel transfers as additional end demand.
Replacement demand and component content
Component demand can come from new devices, replacement devices, repair, refurbishment, and inventory restocking. The installed base is the stock that can be upgraded, repaired, or replaced. It changes more slowly than quarterly shipments and can support service or accessory demand after a new-device cycle cools.
For a defined device cohort, use this identity:
Ending installed base = opening installed base + new devices activated - retirements - devices leaving the addressable geography.
Then split new activations from replacements. A household that replaces a phone creates a new unit but may not expand the number of active users. An enterprise that adds rugged tablets may expand the installed base and also create a different bill of materials. A repair may consume a display, memory package, or camera module without appearing as a new device shipment.
Do not infer replacement rate from shipment growth alone. You need a starting stock, retirement behavior, activation or usage evidence, and the geography or customer segment being measured. When those fields are unavailable, present shipments as a top-of-funnel signal and mark replacement demand as an open research item.
Translate units into component content
The bridge from devices to components is a bill-of-materials problem. For each device family, estimate or document component content per unit: memory density, display type, camera count, radio front-end modules, power-management devices, sensors, connectors, packaging level, and other relevant items. Content can rise while units are flat if the mix moves toward larger memory, more cameras, higher radio complexity, or advanced packaging.
Content is also a qualification and allocation question. A component may be designed into a product but sourced from several vendors, dual-sourced by region, or replaced during a product refresh. A package may combine several dies, so counting each die as an incremental finished component can double count the same commercial object.
Use a content record with an explicit version date. Keep the device family, model tier, region, production window, component description, units per device, approved supplier set, and confidence level together. If a public teardown or supplier filing informs the record, cite it; if the bill of materials is proprietary, preserve the uncertainty instead of filling the row with an average.
Application mix and the value per device
Supplier filings show why application revenue is not the same as device shipment value. Qualcomm's fiscal 2025 annual report separates its QCT equipment businesses from QTL licensing. QCT revenue is recognized when equipment or products are delivered under the applicable obligation, while QTL licensing revenue is principally tied to royalties through licensees' mobile handset sales and recognized under a different pattern. Both can be exposed to handsets while observing different events.
Use the supplier's own segment and timing definitions. A handset application line can include content sold into several device generations. A licensing line can follow licensee sales rather than the supplier's shipment date. An automotive or IoT line can grow while handsets decline because the supplier's mix is changing. These facts help locate exposure; they do not create a universal conversion factor from device units to supplier revenue.
For every supplier metric, capture the application scope, accounting period, unit, recognition rule, geography, and exclusions. Keep a supplier's reported result beside the device indicator, not inside the device total. This makes it possible to ask whether the relationship is causal, lagged, mixed, or merely coincident.
Treat ASP and mix as first-order variables
Units are only one term in component economics. Revenue is affected by average selling price, density, package, performance tier, channel discount, and product mix. A supplier can report higher revenue with fewer bits or units when price and mix improve. It can report lower revenue with stable device shipments when customers move to lower tiers or inventories are liquidated.
Micron's 2025 Form 10-K discusses DRAM and NAND revenue in relation to bit shipments and average selling prices, along with customer inventory, supply allocation, and price-protection considerations. Those disclosures support a two-axis analysis: physical content and value per content unit. They do not support treating memory revenue as a direct multiple of smartphone shipments.
Build separate sensitivities for units, content, ASP, and mix. If a device mix shifts toward premium models, the relevant component value may rise even if total devices do not. If a memory supplier cuts price to clear inventory, component units may hold while revenue falls. A model that includes only shipments hides both effects and can send procurement or investment decisions in the wrong direction.
Inventory and manufacturing lead times
Inventory changes can lead or lag component demand. A device maker may build ahead of a launch, a distributor may destock after a weak season, or a component supplier may ship into customer inventory before the finished units reach consumers. Inventory is not automatically a problem; it is a timing variable that must be reconciled with production, sell-through, and future orders.
Track at least four inventory locations: OEM finished goods, OEM component inventory, distributor or retailer inventory, and supplier finished or work-in-process inventory. Add days or units where disclosed, and mark the owner and valuation basis. A supplier's write-down or price-protection charge may reveal channel pressure without identifying the exact device count that caused it.
The correct output may be a lagged relationship: component shipments in period t support device production in t+1, while supplier revenue is recognized in t or over a contract term. Do not smooth away that lag. Show the observed period and the hypothesized lead or lag, then test it against purchase orders, production schedules, or later sell-through.
Distinguish wafer, package, test, and finished-device timing
The manufacturing chain adds more timing boundaries. A foundry may record a wafer shipment, an outsourced semiconductor assembly and test provider may record packaging or test services, and an OEM may record a finished device. The same design can appear in all three layers with different units and periods.
TSMC's 2024 Form 20-F reports wafer shipments in 12-inch-equivalent terms, technology capacity, products, and end-market exposure. A wafer equivalent is a capacity and manufacturing measure; it is not a count of finished phones or a direct estimate of their component value. Preserve the conversion boundary when comparing fab activity with device shipments.
Amkor's 2024 Form 10-K describes assembly, advanced packaging, wafer-level processing, system-in-package, and test services for smartphones and other applications. A system-in-package can combine several components into one package, so package units, die units, and device units should remain separate columns. A capacity increase or an advanced-package design win may signal future content without proving current finished-device demand.
Qualification, repair and aftermarket exposure
A design win is evidence of potential content, not recognized demand. Qualification, sampling, pilot builds, and production approval sit on a path from engineering intent to recurring shipments. A component can be selected and later removed, delayed, dual-sourced, or restricted to one region. Conversely, a mature component may ship at scale without a new public design-win announcement.
Create a stage field: concept, sample, qualification, approved design, production, ramp, mature, or end-of-life. Record the device family, expected production window, approved source count, package or die revision, and evidence date. Do not turn the number of announced design wins into a device or revenue forecast unless a source supplies a validated conversion.
Broadcom's 2025 Form 10-K describes custom silicon, connectivity, and infrastructure products that can sit inside broader system and end-market programs. Its product exposure shows why qualification and platform relationships matter, while its reported segment boundaries still govern what can be counted as supplier revenue. Use the filing to define the layer, then seek program-specific evidence before sizing capture.
Account for repair, refurbishment, and aftermarket demand
New-device shipment series normally exclude or separately treat refurbished units. Repair and aftermarket consumption can therefore support component demand after primary shipments weaken. Displays, batteries, cameras, memory, connectors, and packaging inputs may be sold through service networks, independent repair channels, or refurbishment operators rather than the original device build.
Apple's filing discusses warranty, AppleCare, repair, replacement, and service offerings alongside product sales. Those activities remind the analyst to ask whether a component opportunity is tied to a new unit, a warranty event, a paid repair, or a refurbishment program. The payer, part number, quality grade, and channel can differ across those uses.
Separate the primary and aftermarket ledgers. Count a replacement display once as a service part, even if the repaired phone later re-enters a refurbished-device shipment series. If the data cannot distinguish new from recovered units, state that limitation. An aftermarket scenario can be useful, but it should not be silently added to new-device demand.
Reconcile supplier transactions at one endpoint
A purchase order, component shipment, invoice, cash receipt, and recognized revenue are different events. A supplier may book a long-term order, deliver material in batches, invoice on a schedule, and recognize revenue at delivery or over a service period. A device maker may capitalize components into inventory before recognizing a finished product sale.
Use a period bridge with one row per event:
Scroll horizontally to compare all columns.
| Shipment and component layer | Buyer or supplier evidence | Unit and period | Interpretation |
|---|---|---|---|
| Finished-device sell-in | OEM or channel shipment disclosure | devices in the stated quarter | new units entering a route, not necessarily consumer use |
| Finished-device sell-through | retailer or activation evidence | devices sold or activated | end demand under the source definition |
| Component purchase order | contract, forecast, or booking | component units and commitment date | intended supply, not delivered content |
| Component shipment | supplier delivery or distributor receipt | dies, packages, modules, or parts | physical movement at a layer |
| Wafer start or shipment | foundry capacity or wafer report | wafer equivalent and fab period | manufacturing activity, not finished units |
| Package and test output | OSAT service or production evidence | packages, lots, or test units | processing layer with its own yield and timing |
| Recognized revenue | supplier filing or ledger | currency and accounting period | reported result under the issuer's boundary |
This table is a reconciliation aid. It is not a set of values to sum. When a source uses a different period, retain both dates and explain the expected lag. If a supplier does not disclose a component-specific split, leave the allocation unavailable rather than inferring it from a broad segment.
Prevent double counting across OEM and component suppliers
The same economic demand can appear in a finished-device sale, an OEM inventory addition, a component supplier shipment, a foundry wafer, and an OSAT package. These are linked observations, not independent market totals. The risk is especially high when a market-research report combines device applications, component categories, and supplier revenue in one chart.
Choose one endpoint for the headline question. It may be finished-device sell-through, component units, supplier revenue, or a reachable procurement opportunity. Keep upstream and downstream measures in an evidence graph, then document each edge. If an amount cannot be allocated to a unique endpoint, mark it as context rather than adding it to the total.
Apply a buyer-specific component capture filter
A component category can be attractive while remaining unreachable for a particular buyer. Filter the opportunity in five steps:
- Device eligibility: confirm the device family, geography, production window, and new versus aftermarket scope.
- Content eligibility: document the part, density, package, performance tier, approved source, and qualification status.
- Channel access: identify the OEM, contract manufacturer, distributor, design house, or service network that controls the purchase.
- Capacity and timing: test wafer, package, test, logistics, and inventory availability for the decision period.
- Economic capture: separate unit price, mix, rebates, yields, warranty returns, services, and the supplier's recognition rule.
The result should be a set of cases when evidence is incomplete. A vendor can have a qualified design but no allocation in the target region. A contract manufacturer can buy a part while the brand owner controls the approved supplier list. A new-device signal can be strong while repair demand is served by a different channel. Each filter changes the reachable opportunity.
A worked device-to-component forecast
The following bridge is deliberately fictional. It demonstrates the calculation structure and does not represent an OEM, market share, supplier forecast, or recommended purchase. Every input is invented solely to show how a buyer can separate device flow, component content, channel inventory, and recognized revenue.
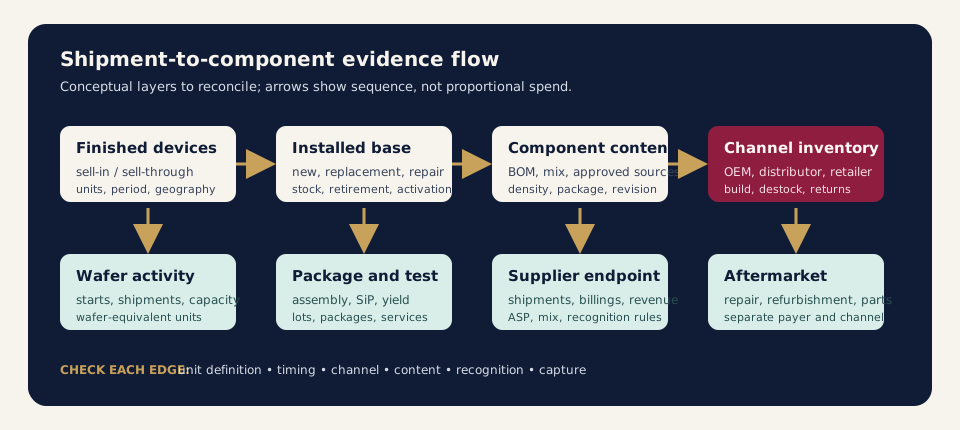
Conceptual shipment-to-component flow for analysis only. The arrows show an evidence sequence; they do not show a proportional share or a forecast.
Scroll horizontally to compare all columns.
| Fictional bridge step | Illustrative input | What it can answer | What it cannot answer |
|---|---|---|---|
| New devices entering channel | 1,000,000 units in a quarter | how many new units are in the defined route | whether units reached consumers or expanded the base |
| Opening and closing channel stock | 140,000 and 180,000 units | whether sell-in added inventory during the period | which supplier parts are inside that stock |
| Replacement share | 72% of activations | whether most units replace an existing device | the retirement timing or aftermarket part demand |
| Memory content | 6 units of a defined package per device | a component-unit scenario for this device mix | approved-vendor share, density price, or package yield |
| Package and test output | 5,900,000 packages after stated yield | a downstream physical-flow case | recognized revenue or final device sell-through |
| Supplier recognition | currency amount under a named contract | the reporting endpoint for that supplier | total component demand across every vendor |
The numbers are intentionally simple and fictional. A real bridge would replace each one with a dated source, a unit definition, an owner, and a confidence note. It would also split device tiers, regions, dual-sourced parts, inventory locations, and repair channels. The bridge is useful because it makes missing evidence visible; it is not a claim about the hardware market.
Turn evidence gaps into research questions
Translate each unknown into a question tied to a decision:
- Shipment boundary unknown → Does the series measure OEM sell-in, retail sell-through, activation, production, or installed stock?
- Content unknown → Which device family, revision, density, package, and approved suppliers are in scope during the period?
- Mix unknown → What share of units is premium, mainstream, entry, enterprise, regional, or aftermarket?
- Inventory unknown → Where are units and components held, and what evidence shows a build, destock, or write-down?
- Timing unknown → What lead or lag connects purchase order, wafer, package, device production, sell-through, and revenue recognition?
- Capture unknown → Which buyer, contract manufacturer, distributor, or service channel can the named supplier actually reach?
The strongest question is falsifiable and scoped. “How many components will devices need?” is too broad. “For the target OEM's next regional production window, which qualified memory package is in the approved bill of materials, how many units are scheduled, and when will the supplier recognize the sale?” identifies the device, part, period, channel, and evidence owner.
The forecast's decisive inputs are model-level component content, qualified supplier allocation and the build schedule. Update those when a product design or channel stock position changes. For a supplier shortlist, investigate the programmes it can actually serve; a broad device total supplies context but does not establish that allocation.
Discuss the evidence you need
Define the market, geography and questions your research must answer.
Sources
- IDC: Smartphone Market Share
- Apple: Form 10-K for the fiscal year ended September 27, 2025
- Qualcomm: 10-K for the year ended 2025-09-28 (filed 2025-11-05)
- Micron Technology: Form 10-K for the fiscal year ended August 28, 2025
- Amkor Technology: 10-K for the year ended 2024-12-31 (filed 2025-02-21)
- TSMC: 2024 Form 20-F (filed 2025-04-17)
- Broadcom: Form 10-K for the fiscal year ended November 2, 2025