
An AI tool used by a sales team and an AI system connected to a company's operational records create different integration jobs. The second may require data preparation, identity controls, interfaces and ongoing support; the first may already be included in a software subscription. For a services provider, the valuable distinction is the work a buyer intends to commission.
Eurostat's December 2025 adoption release helps identify a population in which to investigate that work. This article explains the survey's scope, separates deployment stages and builds a conditional model of annual external integration demand. It uses evidence available by 31 December 2025; later releases and revisions are outside this edition.
What the 2025 survey tells a services provider
Eurostat's release of 11 December 2025 reports AI use by 20.0% of covered EU enterprises in 2025, compared with 13.5% in 2024: a rise of 6.5 percentage points. These are the rounded values in the contemporaneous release. The numerator is enterprises reporting at least one listed AI use; the denominator is the covered enterprise population. This article does not substitute more precise values from a later publication.
The release covers enterprises with at least ten employees or self-employed persons in specified NACE Rev. 2 activities. It therefore excludes micro-enterprises below that threshold and does not describe every public organization or business. A buyer should preserve those exclusions when building an account universe. The 2025 release supplies an adoption rate, not a named customer list or a count of funded integration projects.
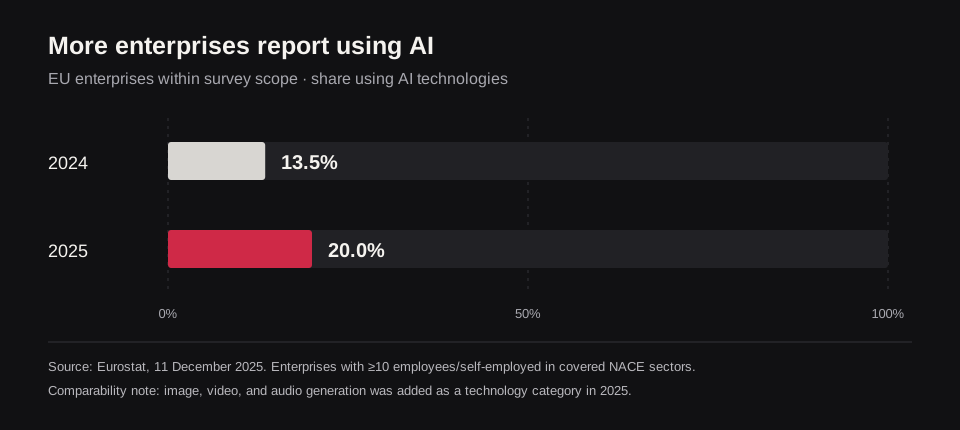
Published adoption shares for enterprises within Eurostat's survey scope. The 6.5-point change is an adoption indicator, not services-revenue growth.
The result answers a useful descriptive question: how widespread is reported use of the listed AI technologies among enterprises within the defined survey universe? It does not identify the software used, the number of deployments, whether use is experimental or production-grade, whether work was performed internally, or what any enterprise spent.
Do not relabel adoption growth as market growth
The change from 13.5% to 20.0% is 6.5 percentage points after rounding. Dividing 20.0 by 13.5 and subtracting one produces a relative change of roughly 48%. That arithmetic can describe the movement in the published adoption share, subject to the survey's comparability limits. It cannot support the statement that an AI integration market grew by 48%.
The methodological notes in the December 2025 release identify image, video and audio generation as a new questionnaire category and describe the expanded language-generation item. A comparison must retain that instrument change. Growth in the reported share may reflect diffusion and a wider measurement boundary; the release does not apportion the increase between those drivers.
Four different quantities are often collapsed in a weak opportunity claim:
- the share of enterprises reporting any qualifying AI use;
- the share operating AI in a process that requires integration;
- the share commissioning a paid external project in a selected year; and
- the supplier revenue generated by those projects.
Each transition needs its own definition, period, and evidence. A precise value at the first stage does not remove uncertainty at the other three.
Find the buyers and workflows that fit the offer
Enterprise size changes the buying question even when it does not establish a services market. A large organization may connect more systems and need more governance, while also retaining internal engineering capacity. A smaller organization may adopt an embedded tool with little bespoke work, or outsource a narrow implementation. This edition does not use size-specific percentages from publications issued after 2025. Segment the actual target population before assigning project incidence or contract values.
Size also does not map mechanically to supplier revenue. A large organization may support a complex programme but retain substantial engineering capacity internally. A smaller organization may buy a configured cloud product with little bespoke work, or it may rely heavily on an external partner. The relevant commercial variables are the workload, architecture, sourcing choice, and buying event rather than employee count alone.
Sector is another research dimension rather than a revenue multiplier. A provider targeting regulated workflows, industrial operations or customer service should investigate the process, architecture and buying event in that sector. High reported adoption could coexist with internal delivery, mature platforms or intense competition. This edition does not rank sectors using the later detailed-results publication.
A defensible market screen therefore keeps at least four dimensions visible: country, enterprise size, economic activity, and the process in which AI is used. It also records which entities are outside the survey universe. A broad EU percentage is context for that screen, not a substitute for it.
Using AI is different from integrating it into a workflow
Eurostat asks whether an enterprise uses any of a list of technologies. That can include analysing text, recognising images, generating language, generating media, machine learning for data analysis, automating workflows, or enabling autonomous movement. Some uses may be available inside software the enterprise already licenses. Others may require new data pipelines, identity controls, application interfaces, monitoring, human review, or changes to an operational system.
An enterprise can use AI for marketing, administration, production, security, finance or research without commissioning a separately priced integration project. Record whether the use runs inside an existing licensed application, connects distinct systems, requires new data controls, or has an approved delivery budget. Multiple uses within one enterprise should not be added as if each represented a new customer.
The European Investment Bank's 2025 EU survey offers another view. It asks about systematic use of generative AI across named business areas and reports that 55% of EU firms using AI applied it in at least two processes. Its population, question, AI definition, and base differ from Eurostat's. The result is useful evidence about breadth within a different survey, but averaging the two adoption rates would create a number with no coherent denominator.
For an integration provider, process breadth may indicate architectural complexity, but it still does not reveal a contract. One enterprise may connect several workflows through an existing suite. Another may run one regulated process that requires extensive data, security, testing, and governance work. Count the integration objects and delivery requirements rather than assuming every reported use has equal commercial value.
The evidence needed to connect adoption to procurement
The table below separates public signals from the missing commercial variables. “Available” means the cited source provides the stated indicator for its own population and period. It does not mean the source answers the supplier's market-sizing question.
Scroll horizontally to compare all columns.
| Evidence layer | What evidence available by end-2025 can show | What remains unknown | Use in the decision |
|---|---|---|---|
| Covered enterprise population | Survey universe, size classes, activities, and approximate frame size | Named target accounts and micro-enterprises outside scope | Define the starting denominator and exclusions |
| Reported AI use | Adoption share by year, size, country, technology, and activity | Deployment depth, product, workload, and production status | Screen segments; do not assign revenue |
| Business purpose | Processes in which adopters report AI use | Number of systems, interfaces, users, and controls | Form hypotheses about integration complexity |
| Adoption friction | Expertise, legal, privacy, data, compatibility, and cost barriers among a defined non-user group | Whether a buyer will fund a project or use an external supplier | Design research questions; do not count every barrier as demand |
| Investment context | EIB 2025 survey evidence under its own firm and process definitions | Monetary integration budget, external-services allocation and actual supplier spend | Form investment hypotheses; obtain matched buyer and procurement evidence |
| External integration demand | No official source reviewed here provides this total | Funded project incidence, outsourcing share, fees, timing, and renewal | Requires buyer, procurement, supplier, and delivery evidence |
The bridge is intentionally incomplete. Its main analytical result is that the public adoption indicator cannot, by itself, produce annual integration-services revenue. That is a useful finding because it identifies exactly which evidence should be commissioned instead of filling the gaps with an arbitrary multiplier.
Treat barriers as possible work, not booked demand
The OECD's 2025 study of AI adoption in firms examines skills, data and implementation conditions. Use those conditions to form buyer questions about expertise, privacy, system compatibility and cost. This edition does not attach percentages from later Eurostat barrier tables or treat a reported obstacle as a funded procurement event.
Some barriers can create integration work. Incompatible systems may require interface design; poor data may require engineering and governance; a skills gap may support advisory or managed services. The same barrier can also stop spending, delay a decision, lead to an off-the-shelf product, or cause the organization to abandon the use case. Classifying every constrained enterprise as a buyer reverses the meaning of the evidence.
The OECD's study of AI adoption in firms likewise treats data foundations, cloud capability, skills, collaboration, and implementation obstacles as parts of the adoption system. That framework helps define supplier capabilities and research questions. It does not provide a current EU total for externally purchased integration services.
For each barrier, research three follow-on questions: Is the issue important enough to release budget? Can an external provider resolve it within the buyer's constraints? Will the work occur inside the forecast period? Only an affirmative, evidenced path through those questions belongs in a demand model.
Set the integration-services boundary
“AI spending” can include hardware, cloud consumption, model or application subscriptions, data acquisition, internal salaries, consulting, implementation, integration, security, training, governance, and managed operations. “Systems integration” can also include work unrelated to AI. A model needs a boundary narrow enough that every included euro represents the same commercial concept.
For an external AI integration-services estimate, a practical boundary might include paid discovery directly tied to implementation, data and interface engineering, configuration, testing, deployment, and contracted operational support. It might exclude software licenses, cloud consumption billed directly by another provider, hardware, internal labour, broad strategy work, and unrelated application modernization. Another decision may need a different boundary; the rule is to state it before gathering values.
Avoid value-chain duplication. If a prime contractor bills the buyer and pays a specialist subcontractor, adding both invoices counts the same end-customer project twice unless the model explicitly measures gross ecosystem transactions. Pass-through cloud or license charges also need a consistent treatment. Use net supplier revenue when comparing the opportunity with delivery capacity and revenue targets.
Separate one-time and recurring work. Initial integration, migration, and testing are project flows. Monitoring, maintenance, model updates, and managed operations may recur against an installed base. Applying a recurring fee to every enterprise that has ever reported AI use ignores whether the provider deployed, supports, or can reach those systems.
Use investment surveys without inventing a services allocation
The EIB Investment Survey 2025, released in October 2025, places digital adoption within firms' investment decisions. Its questions and population differ from Eurostat's enterprise-use indicator. It can inform hypotheses about deployment breadth and financing constraints, but it does not supply an external AI integration-services revenue total.
Do not manufacture a budget allocation from adoption. Establish the monetary investment base, the amount assigned to the particular workflow, the external-delivery decision, the implementation window and the supplier fee. A stated intention, a signed project and recognized revenue are separate observations.
This edition leaves the external-services allocation unavailable in the reviewed evidence. Research should first match geography, enterprise population, investment definition, reference period and weighting, then collect buyer and procurement records for the specific service. Later survey findings are outside this edition's evidence window.
Segment accounts by their next buying event
A single adopter/non-adopter flag is too coarse for a supplier pipeline. A practical segmentation follows the buying event:
- Embedded-tool user: uses AI supplied inside an existing application and has no separate integration project.
- Experimenter: tests a use case with limited data or users; may need discovery, security, or architecture support before a production decision.
- Workflow deployer: has an approved process, owner, budget, and implementation window; this is the clearest project-incidence group.
- Portfolio expander: connects additional processes, data sources, countries, or business units after an initial deployment.
- Operator: maintains production systems and may buy monitoring, assurance, optimization, or managed service work.
These states should be mutually defined for the model period even when an enterprise runs several initiatives. Count projects separately only when they have distinct scopes and budgets. Record movement between stages so a pilot does not appear again as a new adopter and a new deployment without reconciliation.
The segmentation also exposes a provider's fit. A specialist in regulated production systems should not value an embedded office-tool user like a funded workflow deployer. A managed-service provider needs an installed base it can support. A platform consultancy may benefit from portfolio expansion. The market question should match the actual offer.
A worked demand model and its sensitive assumptions
Annual external integration revenue can be expressed as:
target enterprises × qualifying workflow share × funded project incidence × external delivery share × projects per buyer × net supplier revenue per project
Consider a fictional territory and service definition with 4,000 target enterprises. Assume separate buyer research—not the Eurostat rate—supports a 30% qualifying-workflow share. If 25% of that group funds a project during the year, 60% of projects use external delivery, buyers commission 1.1 relevant projects on average, and net supplier revenue is EUR 80,000 per project, the calculation is:
4,000 × 30% × 25% × 60% × 1.1 × EUR 80,000 = EUR 15.84 million
Every number in this example is invented solely to demonstrate the bridge. It is not an estimate for the EU, euro area, any member state, or any real service category. None of the assumptions is derived from the 20% adoption figure.
The model's sensitivity is commercially informative. If the external delivery share is 30% rather than 60%, with every other fictional input unchanged, the result halves to EUR 7.92 million. That directs research toward make-or-buy behaviour. A similarly large change in project incidence would prioritize budget timing. Sensitivity analysis identifies which uncertainty deserves evidence; it does not attach a probability to the range.
An obtainable-market model needs another layer: target account access, eligible geographies, channel reach, competitive win rate, delivery capacity, and ramp time. Do not call the total addressable pool a sales forecast. Reconcile the number of implied projects with how many the provider can actually sell and deliver.
Research the budget, contract and delivery path
A focused research programme can close the missing links without repeating the broad adoption survey.
- Define the target account frame. Specify countries, activities, size bands, excluded entities, and the service boundary. Reconcile it with Eurostat's population before using an official rate.
- Measure deployment state. Ask about named business processes, production status, systems touched, data readiness, controls, and the implementation deadline. Avoid treating employee experimentation as an enterprise programme.
- Verify the funded event. Identify the budget owner, approval status, procurement route, expected start, and what could cancel or delay the project. A general intention to invest is not a purchase order.
- Test sourcing behaviour. Separate internal delivery, software-vendor services, systems integrators, specialists, and mixed teams. Ask which work package an external provider would actually receive.
- Build a contract-value distribution. Use comparable completed contracts or buyer budgets, with project scope, geography, buyer size, pass-through costs, and outliers recorded. A single average can misstate a skewed market.
- Reconcile supply evidence. Compare buyer results with provider bookings, public procurement where applicable, partner pipelines, implementation capacity, and renewal data. Keep pipeline, backlog, recognized revenue, and ecosystem value distinct.
Sample design matters. Easy-to-reach technology leaders can overstate maturity and budgets; small non-users can dominate an enterprise-weighted population. Weighting cannot repair a frame that excludes the buyers of interest. Publish enough methodology to show who was asked, how they were recruited, when fieldwork occurred, which questions supplied each estimate, and where non-response or selection may matter.
Decision rules for suppliers and investors
Use the 2025 adoption result as a market signal when it helps choose where to investigate. It supports the view that AI use is becoming more widespread among covered EU enterprises, with differences by country and reported technology in the contemporaneous release. It can also identify groups in which workflow and integration questions merit deeper research.
Require stronger evidence before committing resources:
- Enter or expand only when a defined segment shows funded project incidence, an external-delivery path, viable contract economics, and reachable demand above the provider's threshold.
- Run a focused pilot when buyer need appears credible but project timing, sourcing, or repeatability remains unresolved. Set the evidence and switching value before the pilot.
- Reshape the offer when demand exists but most value sits in software, internal delivery, data preparation, governance, or managed operations outside the current service boundary.
- Stop or defer when the model depends on applying the EU adoption percentage directly to revenue, borrowing a spending share from a different survey population, or assigning budgets to firms that only report a barrier or an experiment.
Track leading and lagging evidence separately. Qualified budgets, tenders, architecture assessments, and funded pilots can lead recognized revenue. Signed contracts, delivered projects, net fees, renewals, and churn are observed commercial outcomes. Adoption indicators provide context around that funnel; they are not outcomes inside it.
The next research priority depends on the offer. A project consultancy needs evidence of funded deployments and external delivery; a managed-service provider needs an accessible installed base and support contracts. Size those buyer groups separately before combining them. Use the software and cloud hub for the sector context or scope a buyer study around the deployment stage you can serve.
Discuss the evidence you need
Define the market, geography and questions your research must answer.