
The battery requirement of an electric-car programme depends on the vehicles it sells. A small plug-in hybrid and a long-range battery-electric car carry different amounts of energy, and their cells can come from different plants under different contracts. Battery demand therefore begins with the model and powertrain mix.
The next questions concern supplier allocation and value: which cell or pack maker serves the programme, what is shipped, and how the price responds to materials and product mix. This analysis connects those decisions using evidence available through December 2025, with a clearly hypothetical calculation.
Vehicle and powertrain mix establish the starting population
Begin with the unit and event in the source. The IEA Global EV Outlook 2025 trends page reports electric-car sales and sales shares by period and geography. It also distinguishes electric cars from the wider vehicle stock and discusses the concentration of sales across models and markets. A sales count is an end-market observation; it is not automatically an OEM production count or a battery shipment count.
Record the following fields before using an EV series:
- Vehicle boundary: passenger car, van, bus, truck, two-wheeler, or another mode.
- Event: wholesale delivery, retail sale, registration, activation, or production.
- Powertrain: battery electric, plug-in hybrid, hybrid, fuel-cell, or a source-specific “electrified” group.
- Period and geography: month, quarter, fiscal year, country, region, or global.
- Condition: new vehicle, used vehicle, fleet transfer, or unknown.
- Counting party: government registry, OEM, industry association, research provider, or analyst estimate.
If a government registration series rises, it supports a registration thesis under that government's definition. It does not prove that the same quarter's battery supplier revenue rose. A registration can follow a factory build, a channel transfer, or an inventory release. Keep the event label beside the number so a later analyst does not silently convert sales into production.
Separate BEV, PHEV, and other electrified vehicles
“EV sales” often combines vehicles with very different battery requirements. A battery-electric vehicle typically carries a larger traction battery than a plug-in hybrid, while a conventional hybrid has a different battery role and capacity. Electric buses and trucks can have much larger packs and different replacement and fleet cycles than passenger cars. A single vehicle count therefore hides the energy content and supplier mix.
Use a mutually exclusive powertrain taxonomy. If the source combines BEV and PHEV, preserve the combined label and mark the energy conversion as unavailable unless the split is supplied. The IEA battery analysis treats battery deployment as a volume-weighted measure linked to vehicle sales and average battery size. That definition is useful because it makes the missing capacity variable explicit.
Do not add BEV, PHEV, and hybrid counts if one category already contains another. Do not apply a BEV pack assumption to every “electrified” vehicle. For a supplier opportunity, retain the vehicle class, powertrain, and market policy that produce the demand. A fleet conversion can create high energy content with fewer vehicles; a small-car subsidy can create more vehicles with lower energy per unit.
Pack energy turns vehicles into a battery-volume scenario
The first analytical bridge is from vehicles to energy. A simple scenario is:
Battery deployment = vehicle sales × average usable or rated pack energy.
The choice between usable and rated energy must follow the source. Pack energy can be reported in kilowatt-hours, while cells may be ordered in watt-hours or gigawatt-hours. A supplier may quote nominal capacity, a vehicle maker may disclose usable capacity, and a market study may use a volume-weighted average. Those measures are related but not interchangeable.
The IEA's 2025 battery analysis defines EV battery demand from vehicle sales and volume-weighted average battery size, by mode or region, excluding stockpiling. It reports EV battery demand above 950 GWh in 2024. Its wider energy-sector battery total also includes stationary storage and has a different boundary. Sales affect deployed energy only after vehicle mix and pack size are specified; neither total is a supplier-revenue observation.
Build a capacity ledger with vehicle family, pack energy, chemistry, usable-versus-rated flag, sales event, geography, and revision date. When pack energy is unknown, show a range or leave the conversion open. A supplier revenue model should not use a single global kWh assumption simply because the vehicle count is available.
Keep model mix and pack architecture visible
Average pack energy can change while EV sales are flat. A market may shift toward SUVs, premium vehicles, long-range versions, commercial vans, or smaller city cars. Structural packs, cell-to-pack designs, dual-motor configurations, and thermal-management choices also change content and supplier responsibilities. The number of vehicles alone cannot show those changes.
Use model-level or tier-level mix where possible. Record vehicle platform, production site, pack family, cell format, chemistry, module architecture, and approved battery supplier. A vehicle may have different packs by region or model year, and a supplier may provide only selected variants. A design change can increase energy per vehicle while reducing the number of modules or pack components.
Deployment, shipments and the supplier layer
Battery deployment measures energy installed in vehicles. Cell shipments measure a supplier's physical movement of cells, which can lead or lag vehicle sales. A cell producer can ship into a customer's inventory before a vehicle launch, while a vehicle maker can sell cars from packs produced in an earlier quarter. Production, shipment, installation, and registration are four different events.
Use a flow identity rather than a single growth line:
Opening cell and pack inventory + production or purchases - shipments to the next layer = closing inventory.
Then connect pack installation to vehicle production and vehicle production to sales or registrations. If one bridge term is estimated, identify it. If a battery supplier reports gigawatt-hours sold but not the installed vehicle count, do not divide the two without matching period, chemistry, and end market.
A cell manufacturer's physical sales can serve both transport and stationary energy storage. Separate those applications before comparing shipments with batteries installed in new passenger cars. A GWh shipment measure describes energy capacity moving through a supplier's boundary; recognized revenue also depends on product mix, contract terms, realized price and recognition timing. This edition does not use subsequent full-year 2025 manufacturer releases.
Map the battery value chain
The supplier endpoint depends on where the buyer's transaction sits. A cell maker may sell cells to an automaker or pack integrator. A module or pack assembler may purchase cells and sell a finished battery system. An automaker may manufacture some packs internally and buy other cells from qualified partners. A materials producer may sell lithium, nickel, graphite, electrolyte, or cathode inputs under a different contract and price basis.
Use a chain with explicit hand-offs:
- vehicle sale, registration, or production;
- pack energy and chemistry in the defined vehicle mix;
- cell production and shipment;
- module, pack, battery-management, and thermal integration;
- materials and component purchases;
- supplier invoice, billings, or recognized revenue; and
- warranty, replacement, recycling, or second-life activity.
One company can occupy several layers, but the model must preserve each layer's unit. A vertically integrated OEM may record vehicle revenue while using internal cells; an independent cell supplier may record a sale to the OEM; a materials supplier may record a sale to the cell producer. Adding all three as “battery market revenue” counts the same vehicle program multiple times.
Read supplier revenue by its own boundary
Supplier filings are strongest when they define what a revenue line includes and how it is recognized. They are not interchangeable with vehicle sales. Tesla's 2024 Form 10-K states that automotive sales revenue includes vehicle deliveries and certain connected features, while services and other revenue includes used vehicles, maintenance, collision, charging, insurance, and parts. It also reports energy generation and storage separately.
Tesla's 2024 filing, issued in January 2025, separates automotive sales, services and other activities, and energy generation and storage. Those reporting boundaries prevent a total automotive or battery-related revenue line from being treated as cell sales. Units, price, mix, financing, software, regulatory credits, leases and services need their own treatment before comparing a vehicle-sales curve with supplier revenue.
For each supplier, record segment name, end market, physical unit, price basis, delivery event, performance obligation, and exclusions. If the supplier reports only total battery or automotive revenue, keep the component allocation unavailable. A broad segment can show exposure without proving how much belongs to traction cells.
Chemistry, pricing and production capacity
Chemistry changes energy density, material intensity, cost, safety requirements, qualification, and supplier choice. LFP, nickel-based chemistries, high-voltage variants, solid-state programs, and other designs can serve different vehicle tiers. Cell format—prismatic, pouch, or cylindrical—changes equipment, pack integration, yield, and the commercial role of a module supplier.
LG Energy Solution's 2024 results release of 24 January 2025 separates completed 2024 performance from planned 2025 business initiatives and guidance. That distinction is central to a capacity model: investment intentions and product plans are not completed shipments. Test production timing, qualified customers, utilization and realized prices before assigning revenue to an announced plan.
Model chemistry and format as explicit dimensions. A change from one cell design to another can alter GWh per vehicle, material demand, yield, capital utilization, and supplier eligibility without changing vehicle sales. A supplier may gain volume but lose value per kWh, or gain value through a higher-complexity format while total vehicle units stay stable.
Separate raw-material pricing from battery revenue
Battery revenue can move because of price, volume, mix, currency, and contract formulas. Lithium or nickel prices can flow through an indexed cell contract, remain with the OEM, or be hedged. A lower commodity price can reduce a materials supplier's revenue even when battery volumes rise. A cell supplier can ship more energy while recognizing less revenue per kWh.
Albemarle's 2024 Form 10-K separates Energy Storage sales effects from volume and pricing. Its filing describes lower lithium pricing reducing sales while higher sales volume, driven by customer demand, provided an offset, and notes index-referenced and variable-priced contracts. This is a direct reminder that EV growth can support physical demand while a materials supplier's revenue is pressured by price.
Create a bridge with separate terms for battery energy, cell or pack ASP, material pass-through, currency, rebates, and contract timing. Do not multiply EV sales by a public lithium price and call the result battery-supplier revenue. The material may be sold at a different stage, under a different formula, and in a different period.
Account for localization, capacity, and utilization
New EV sales can create a capacity opportunity without creating immediate supplier revenue. A battery plant may be announced, under construction, commissioning, ramping, or operating below nameplate. Local-content rules and tariffs can redirect sourcing between plants. A supplier can reallocate lines from EV cells to energy storage when vehicle demand softens.
Panasonic Energy's Integrated Report 2025 describes slower EV-market growth alongside higher in-vehicle battery sales volumes, new equipment at its Nevada factory, and upfront costs associated with ramping a Kansas factory. The report supports a capacity, utilization, and cost-timing analysis. It does not turn a vehicle-sales forecast into a guaranteed plant revenue line.
Track site, line, chemistry, customer qualification, nameplate capacity, utilization, ramp stage, and local-content requirement. A plant can have enough theoretical capacity but lack qualified cells, materials, labor, yield, or customer acceptance. Conversely, a mature line can serve a growing vehicle program without a new capacity announcement.
Contracts, inventory and adjacent battery businesses
Automotive supply chains often operate with long-term offtake, take-or-pay terms, prepayments, minimum volumes, and customer-specific qualification. A contract can commit a supplier to capacity while the automaker changes its production schedule. A purchase order can be placed before cells are produced. Revenue can be recognized on shipment, delivery, acceptance, or another performance-obligation event.
Use an event ledger:
Scroll horizontally to compare all columns.
| EV and battery event | Evidence and unit | Period relationship | Commercial meaning |
|---|---|---|---|
| Vehicle sale or registration | vehicles by powertrain and market | end-market period | observed demand under the source definition |
| Vehicle production | finished vehicles and production site | before sale or registration | build activity, not consumer demand |
| Battery deployment | kWh or GWh installed in vehicles | follows pack installation | energy content of the defined vehicle mix |
| Cell or pack shipment | cells, modules, packs, or GWh | may lead or lag deployment | physical supplier movement |
| Contract booking or minimum | units, GWh, price formula, term | commitment period | intended supply, not recognized revenue |
| Invoice or cash | currency and billing terms | billing or collection date | settlement event, not necessarily revenue |
| Recognized supplier revenue | currency and issuer segment | accounting period | reported result under the supplier boundary |
Reconcile opening and closing inventory at the OEM, cell supplier, pack integrator, and distributor where disclosed. A high shipment quarter followed by a production pause may indicate channel stock rather than durable vehicle demand. A low shipment quarter during a launch can reflect inventory drawdown or delayed recognition. Preserve the lag instead of smoothing it away.
Include services, storage, and recycling
Traction-battery suppliers may also sell stationary-storage systems, battery-management software, warranties, service contracts, recycling services, or materials into non-automotive markets. Those activities can improve or weaken revenue while EV sales move in another direction. A cell maker's total lithium-battery sales can include power batteries and energy storage; a vehicle maker can report charging, insurance, parts, and used vehicles outside automotive sales.
EV and stationary-storage applications can compete for manufacturing resources, but the reallocation must be demonstrated for the particular plant and product. Tesla's 2024 filing separates energy generation and storage from automotive activity; LG Energy Solution's January 2025 release distinguishes reported performance from its plans. Keep those endpoints visible rather than assigning every battery shipment to passenger-car demand.
Aftermarket demand also matters. A replacement pack, module, cell, warranty service, or recycled material can create supplier revenue without a new EV sale. A second-life battery can leave the automotive ledger and enter a stationary application. Count the physical object once at the chosen endpoint and record the downstream use separately.
Choose one revenue endpoint and a supplier allocation
The most common errors are predictable:
- adding EV sales to battery deployment as if they were separate demand;
- adding battery deployment to cell shipments without removing inventory and timing overlap;
- adding an OEM's vehicle revenue to a cell supplier's revenue as two battery markets;
- treating a battery supplier's GWh sold and revenue as independent totals;
- counting energy storage, recycling, and traction batteries inside one vehicle-only estimate; and
- applying a broad market-research forecast to a supplier segment with different boundaries.
Choose one headline endpoint: vehicles sold, battery energy deployed, cell or pack shipments, supplier revenue, or a reachable procurement opportunity. Keep the other measures in an evidence graph with an owner, period, unit, and conversion rule. If a unique endpoint cannot be assigned, label the observation as context and do not add it to the total.
Apply a buyer-specific supplier capture filter
A growing EV market does not mean every battery supplier can win the next program. Filter a supplier opportunity in five stages:
- Vehicle eligibility: confirm the target OEM, platform, geography, powertrain, model year, and production window.
- Technical fit: document chemistry, format, energy density, thermal system, safety, software, warranty, and pack architecture.
- Qualification and access: identify approved suppliers, joint ventures, contract manufacturers, local-content rules, and procurement routes.
- Capacity and economics: test line availability, yield, ramp, raw-material formula, currency, logistics, and minimum-volume obligations.
- Revenue endpoint: separate cell, module, pack, materials, services, storage, recycling, and the supplier's recognition rule.
The output should be cases when evidence is incomplete. A supplier may have a technically qualified cell but no allocation at the target plant. An automaker may retain pack assembly while outsourcing cells. A materials producer may benefit from higher volume but lose revenue to price pass-through. Each filter changes the reachable opportunity.
A worked vehicle-to-battery scenario
The following bridge is deliberately fictional. It demonstrates the calculation structure and does not represent an automaker, battery supplier, market share, production forecast, or recommended purchase. Every input is invented solely to show how a buyer can separate EV sales, pack energy, cell shipments, price, inventory, and recognized revenue.
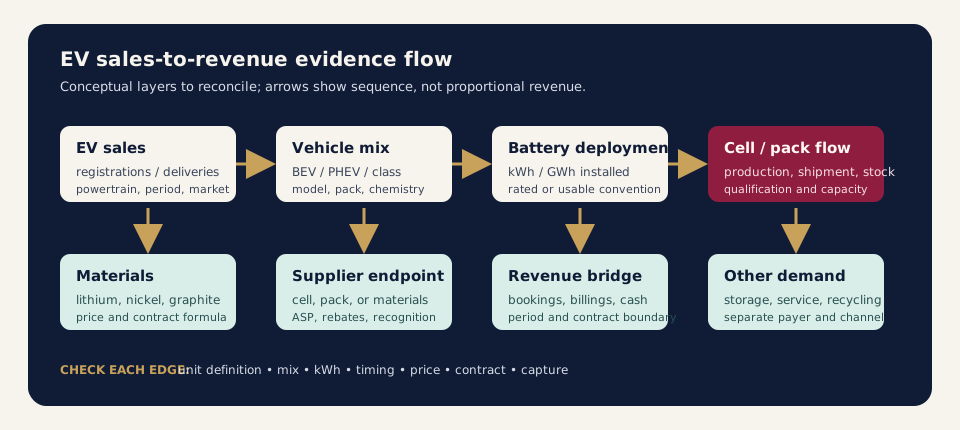
Conceptual sales-to-revenue flow for analysis only. The arrows show an evidence sequence; they do not show a proportional share or forecast.
Scroll horizontally to compare all columns.
| Fictional bridge step | Illustrative input | What it can answer | What it cannot answer |
|---|---|---|---|
| New EV sales | 120,000 vehicles in a quarter | the size of the defined vehicle event | BEV/PHEV split, production timing, or pack supplier |
| Vehicle and pack mix | 70% BEV; 58 kWh average rated pack | a scenario for deployed energy | usable energy, chemistry, pricing, or approved source |
| BEV battery deployment | 4.872 GWh for the BEV portion only | 84,000 fictional BEVs × 58 kWh per pack | PHEV energy, cell shipments, inventory, or supplier revenue |
| Cell shipments | 5.200 GWh after a stated pre-launch build | physical supplier movement | how much remains in customer inventory |
| Average cell ASP | 82 currency units per kWh | a price-sensitivity input | raw-material pass-through, rebates, or currency |
| Supplier revenue | recognized amount under a named contract | the chosen reporting endpoint | total battery demand or other suppliers' capture |
The BEV calculation is 120,000 × 70% × 58 kWh = 4,872,000 kWh, or 4.872 GWh. The remaining 36,000 vehicles are PHEVs; their pack capacity is not supplied, so their energy is unquantified and excluded from this BEV subtotal. The separate 5.200 GWh shipment case must not be presented as total energy deployed in all vehicles.
The numbers are intentionally simple and fictional. A real bridge would replace each one with a dated source, a unit definition, a customer or supplier owner, a chemistry and format, a contract rule, and a confidence note. It would also reconcile plant location, inventory, qualification, warranty, storage, recycling, and the period in which control transfers.
Turn evidence gaps into research questions
Translate each unknown into a question tied to a decision:
- Sales boundary unknown → Is the source measuring registrations, retail sales, wholesale deliveries, production, or used vehicles?
- Energy unknown → What pack capacity and usable-versus-rated convention applies to each powertrain and model tier?
- Supplier unknown → Which cell, module, pack, or materials supplier is qualified for the target platform and plant?
- Price unknown → Is the contract fixed, indexed, pass-through, hedged, or subject to rebates and credits?
- Timing unknown → What lead or lag connects booking, production, shipment, installation, vehicle sale, invoice, and revenue recognition?
- Diversification unknown → What share of the supplier's reported battery activity comes from EVs, energy storage, services, recycling, or other applications?
The strongest question is falsifiable and scoped. “How large is the EV battery market?” is too broad. “For the target platform's next regional production window, which qualified supplier will provide which chemistry and pack energy, under what price formula and minimum volume, and when will the sale be recognized?” identifies a customer, product, period, contract, and evidence owner.
Read the worked battery volume together with its powertrain assumptions; the BEV component cannot stand in for PHEV capacity. Then apply only the sourcing and pricing evidence for the chosen supplier layer. A change in chemistry, allocation or inventory can alter that supplier's result even when the vehicle programme is unchanged.
Discuss the evidence you need
Define the market, geography and questions your research must answer.
Sources
- IEA: Global EV Outlook 2025 — Trends in electric cars
- IEA: Global EV Outlook 2025 — Electric vehicle batteries
- Tesla: 10-K for the year ended 2024-12-31 (filed 2025-01-30)
- LG Energy Solution: 2024 financial results and 2025 initiatives (24 January 2025)
- Panasonic Energy: Integrated Report 2025
- Albemarle: 10-K for the year ended 2024-12-31 (filed 2025-02-12)