
When a hospital adds a service line, the technology work depends on what changes in practice: scheduling, clinical documentation, interfaces, staffing and cross-site data. Some work fits inside an existing platform; other work requires a new module or replacement project. The purchasing decision may sit with the hospital or with a system serving several sites.
A useful market study follows that operating change to its budget owner and procurement window. This analysis uses hospital and technology disclosures available through 2025 to connect capacity, workflows and the installed base, without treating every bed as an equal amount of IT demand.
Capacity and the workload it represents
Write the counting rule beside every capacity number. “Hospital capacity” may mean licensed beds, staffed beds, operating beds, emergency-department bays, procedure rooms, outpatient sites, admissions, discharges, patient days, or a network's combined facilities. These are different units with different operational consequences.
The AHA Fast Facts on U.S. Hospitals, 2025 makes the scope visible. Its sample from the 2023 AHA Annual Survey reports 6,093 U.S. hospitals, 913,136 staffed beds, and 34,426,650 admissions across all U.S. hospitals. The same sheet distinguishes community hospitals, rural and urban hospitals, and hospitals in a system. Those definitions are useful for a national frame, but none is an IT-spend line.
Record the source owner, survey year, geography, facility type, bed definition, service setting, and whether the measure is a stock or a flow. State whether a number describes one campus, a legal entity, a health system, or a market area. If a source joins hospitals under a parent system, preserve that aggregation rather than presenting the result as a single-site budget.
Separate beds, admissions, occupancy, and throughput
Staffed beds describe available inpatient capacity. Admissions describe entries into care. Patient days combine volume and length of stay. Occupancy connects patient days with staffed or licensed beds, but it can move because of either numerator or denominator changes. Emergency-department visits, operating-room cases, imaging studies, and outpatient encounters describe other workflows entirely.
Use a capacity ledger:
Scroll horizontally to compare all columns.
| Capacity signal | What it can establish | What it cannot establish | Evidence needed for the next stage |
|---|---|---|---|
| Licensed or staffed beds | physical or operational inpatient footprint | actual utilization, acuity, or IT budget | staffed-bed definition, occupancy, patient days, and period |
| Admissions or discharges | inpatient throughput in the defined cohort | outpatient demand, case mix, or software spend | service mix, length of stay, payer, and source coverage |
| Patient days or occupancy | intensity of inpatient use under a stated denominator | workflow complexity or future growth | acuity, unit mix, seasonality, and capacity constraints |
| Emergency or procedure capacity | access points and constrained clinical workflows | system-wide purchasing authority | visits, cases, equipment dependencies, and site ownership |
| Outpatient sites | distributed operating footprint | shared versus local technology budgets | site list, service lines, network design, and affiliation |
| Service-line breadth | number of clinical and administrative workflows | number of applications or interfaces | department inventory, data flows, and integration requirements |
| System affiliation | possible central procurement and shared services | the budget allocated to one facility | ownership, delegated authority, contract scope, and renewal calendar |
Do not divide an unbounded “IT market” by beds and call the result an addressable budget. Bed count can be a useful segmentation variable, but it needs workflow and ownership fields before it becomes a commercial cohort.
Service mix and hospital-system authority
Two hospitals with the same staffed-bed count can have very different technology needs. A general hospital, an academic medical center, a children’s hospital, a critical access hospital, and a specialty facility may operate different clinical pathways, regulatory obligations, and integration stacks. A hospital with transplant, oncology, trauma, neonatal, or high-acuity intensive-care services may need specialized systems and data flows that are invisible in a bed total.
Map service lines to workflow events. Identify order entry, medication administration, laboratory, imaging, operating-room, bed management, revenue-cycle, quality reporting, patient access, staffing, and supply-chain processes. Then mark which workflows are shared across the system and which are local. A clinical service can create technology demand through devices, interfaces, analytics, scheduling, cybersecurity, or data retention without creating a new standalone application purchase.
The buyer should distinguish capacity expansion from workflow complexity. Adding beds may require network, endpoint, identity, and clinical-system capacity. Adding a new service line may require specialized modules, interfaces, devices, training, and support. Increasing admissions can increase transactions while the installed platform remains adequate. The evidence must show which of those cases applies.
Read system affiliation and budget authority
The legal hospital, the operating hospital, and the purchasing organization may be different. A campus can be owned by a system, managed by a central office, or subject to a group purchasing arrangement. A health system can hold a single enterprise contract that covers many facilities, while local leaders control implementation, staffing, or departmental tools.
The AHA Fast Facts source defines a system as a multihospital or diversified single-hospital system. That definition is valuable for segmentation, but it does not establish that every affiliated hospital has the same IT budget, implementation date, or vendor relationship. Treat affiliation as a clue about governance, not as proof of spend.
Build an authority map with legal entity, parent system, operating region, chief information officer or equivalent owner, clinical sponsor, procurement group, finance approval, and contract signer. Add the decision level for infrastructure, EHR, cybersecurity, analytics, patient engagement, and departmental applications. A vendor opportunity may be enterprise-wide, regional, or a local exception; the capacity denominator must match that authority.
The installed platform and its integration burden
An installed EHR is evidence of a technology foundation. It is not a current-year software budget, a replacement opportunity, or a statement that the hospital is buying every adjacent tool. The ONC report on non-federal acute care hospital EHR adoption reports near-universal adoption of certified EHRs by 2018 and uniformly high adoption across hospital characteristics by 2024. It also reports that more than 80% of hospitals used one of the three largest EHR developers in 2024.
Those results change the buyer question. A broad “does the hospital have an EHR?” filter has little separation power. The relevant questions are which release, modules, interfaces, hosting model, implementation partner, contract term, and unmet workflow requirements are present. A mature installed base can create renewal, optimization, integration, cybersecurity, and data-quality opportunities without implying a new core-system sale.
Record the EHR as an installed-base field: developer, product family, inpatient and outpatient coverage, deployment model, implementation date, contract or renewal window, and known module gaps. If the source only confirms adoption, do not infer spend, switching intent, or vendor dissatisfaction.
Measure interoperability and data-workflow burden
Capacity creates technology work when data must move between people, departments, sites, devices, public agencies, payers, and third-party applications. The burden depends on the number and type of interfaces, data standards, frequency, latency, identity matching, monitoring, and exception handling. It does not scale linearly with beds.
The ONC hospital API brief reports that approximately nine in ten hospitals enabled patient access through an API in 2024; 71% reported standards-based API access, and 48% reported standards-based API support for patient-generated data submission. The brief also shows variation by hospital bed size and system characteristics. These are capability signals, not software-spend totals.
Use an interface and workflow ledger. Count inbound and outbound feeds, standards, clinical and administrative use cases, data owners, service-level expectations, and manual steps. Then identify the cost bearer: interface engine, EHR vendor, third-party application, internal integration team, managed service, or department. A hospital can have broad API access and still need substantial work to make a particular workflow reliable.
Operating budgets, capital projects and resilience
A hospital IT number can mean an allocated operating budget, a capital request, internal payroll, outsourced services, cybersecurity, a system-level allocation, or a vendor contract. These fields answer different questions. A reported IT budget may include staffing, operations, and supplies while excluding construction, medical equipment, or a central shared-service allocation.
The AHA Annual Survey 2024 questionnaire defines “overall IT budget” as the allocated budget for all IT items for the fiscal year, including staffing, operations, and supplies. It separately asks about internal IT staff and cybersecurity staffing, and instructs system-affiliated respondents to report the overall system cyber budget unless a hospital has an independent cyber budget. The questionnaire is a measurement design, not a public spend result.
For every IT figure, record fiscal year, operating or capital treatment, system versus facility scope, inclusions, exclusions, currency, source method, and whether the value is budgeted, actual, committed, or forecast. If one source reports system cyber budget and another reports facility IT staffing, do not add them without a documented boundary.
Separate operating IT from capital projects
Operating technology supports recurring work: licenses, cloud or hosting, help desk, infrastructure operations, managed services, interface maintenance, security operations, and staff. Capital projects support assets or major implementations: a new data center, network refresh, major EHR implementation, replacement hardware, facility build-out, or large platform migration. A capacity expansion can affect both categories, but the timing and approval path differ.
The AHA questionnaire separately defines capital expenses as expenses used to acquire buildings, remodeling projects, equipment, or property. That definition is broader than software and does not turn every capacity project into an IT purchase. A new tower may trigger technology work, but the spend can sit in construction, biomedical equipment, networking, clinical systems, or shared infrastructure budgets.
Build a project ledger with request date, approval date, funding source, capital or operating classification, implementation window, service-line owner, expected useful life, and recurring run-rate. Use a hospital expansion announcement as a lead for research, not as evidence that a vendor has been selected or a budget has been released.
Trace cybersecurity and resilience requirements
Cybersecurity demand can be driven by exposure, regulation, business continuity, vendor risk, and board priorities as much as by bed count. A small hospital with limited staff can face a difficult security operating model. A large system may centralize security, outsource monitoring, or run a mature platform whose next purchase is a renewal or a control upgrade.
The HHS Healthcare and Public Health Cybersecurity Performance Goals are a voluntary subset of practices that healthcare organizations can prioritize to strengthen preparedness and resilience. They describe safeguards such as vulnerability management, asset inventory, endpoint protection, and third-party risk. They do not assign a dollar budget to a hospital.
Translate the goals into evidence fields: asset inventory coverage, identity controls, network segmentation, backup and recovery, incident response, third-party risk, security operations, staffing, and procurement ownership. Then separate a compliance requirement, a risk response, a technology capability, and a purchased product. The same capacity cohort may have different spend potential depending on its control maturity and sourcing model.
Financial pressure and site complexity
Hospital capacity can affect revenue opportunity, but payment policy and margin pressure mediate the ability to fund technology. Inpatient payment, outpatient payment, payer mix, case mix, quality programs, uncompensated care, and local contracts are distinct pathways. An additional bed does not produce a predictable technology budget when it is empty, poorly reimbursed, or supported by an existing platform.
CMS maintains hospital cost-report information through HCRIS cost reports. The Hospital Provider Cost Report dataset includes facility characteristics, utilization, costs and charges by cost center, Medicare settlement data, and financial statements. Those fields help frame financial capacity, but they do not guarantee that a cost center is a dedicated health IT budget.
CMS’s FY 2025 IPPS materials show how hospital cost-report data support payment calculations, including cost-to-charge ratios used in MS-DRG relative weights. The Hospital Outpatient Prospective Payment System provides a separate outpatient payment framework. Use these sources to map payment context, not to convert admissions directly into technology spend.
Account for geography and site complexity
Hospital systems operate across markets with different labor costs, referral patterns, payer mixes, broadband conditions, regulations, and vendor coverage. A rural critical access hospital, an urban teaching hospital, and a suburban system campus can have similar bed counts but different staffing models and procurement constraints. Sites may share an enterprise platform while carrying different local interfaces, devices, and support costs.
Segment by geography, site type, system affiliation, and service role. Record whether the site is a hub, spoke, specialty campus, emergency facility, outpatient extension, or acquired asset. Add distance to the central IT team, local support requirements, connectivity, and migration status. A distributed footprint may create integration and support work while centralization suppresses local buying authority.
The ONC interoperability brief for 2023 reports higher routine interoperability among larger and system-affiliated hospitals than among smaller and independent hospitals. That is evidence of a difference in capability and resources, not a universal spend multiplier. Keep the direction of the relationship separate from the size of a budget effect.
Procurement and the renewal opportunity
Capacity data describes a potential account. Procurement evidence shows whether a vendor can win work. Identify the buying group, sourcing route, incumbent, contract vehicle, security review, clinical champion, implementation partner, and deployment sequence. A system may buy centrally but implement by region; an independent hospital may use a group purchasing organization or managed service.
The buyer should track four events: budget authorization, purchase order or contract signature, deployment or go-live, and recurring renewal. Each can occur in a different period. A large hospital may have a sizeable potential account but no open buying cycle. A smaller facility in an active replacement cycle may be a better near-term opportunity.
Do not infer vendor capture from hospital size or EHR share. Use public procurement notices, vendor filings, customer references, implementation evidence, contract metadata, and interviews only when the source supports the claim. If the incumbent or decision date is unknown, keep capture probability conditional.
Test installed-base renewal and substitution
The installed base can create recurring opportunity through renewals, upgrades, support, analytics, interface maintenance, cybersecurity, and module expansion. It can also limit near-term opportunity when a hospital has recently completed a long implementation, locked an enterprise contract, or consolidated systems after an acquisition.
Track platform age, contract term, renewal date, module coverage, implementation quality, open gaps, support model, and switching cost. Separate a new logo from an expansion sale, a replacement from an optimization, and a third-party overlay from a core-system displacement. Capacity growth can increase workload on the incumbent without creating a new vendor decision.
Substitution also occurs between internal staff and outsourced services, between point tools and enterprise modules, and between manual work and automation. A hospital may meet a requirement through a service provider or a shared system instead of buying software. The analysis should show which route is being tested.
Apply a buyer-specific capacity-to-spend filter
For a health-technology vendor, investor, provider strategy team, or market-access decision, test the opportunity in seven stages:
- Capacity boundary: define the facility, system, bed measure, service scope, geography, period, and source population.
- Workflow translation: map beds, admissions, sites, service lines, and acuity to concrete clinical, administrative, data, and security workflows.
- Installed base: identify EHR, infrastructure, interfaces, devices, contracts, modules, and support model.
- Budget authority: locate the operating and capital owners, system allocations, approval gates, and procurement route.
- Financial context: reconcile utilization, payer mix, payment framework, margins, cost centers, and funding constraints.
- Commercial timing: test budget authorization, contract, implementation, renewal, replacement, and expansion windows.
- Decision output: choose the governing measure: qualified account count, addressable budget, contract value, recurring revenue, implementation backlog, or renewal opportunity.
The output should be a cohort ledger with explicit unavailable fields. “The system has 2,000 beds” is a capacity statement. “The target system has a defined service mix, identified workflow burden, a documented IT budget boundary, an open procurement or renewal event, and a contract scope that matches the site cohort” is a commercial case that can be tested.
A hospital-system buying scenario
The following bridge is deliberately fictional. It demonstrates the calculation structure and does not represent a hospital, health system, budget benchmark, market size, vendor ranking, contract value, or revenue forecast. Every number is invented solely to show how a buyer can keep physical capacity, workflow burden, budget authority, and vendor capture separate.
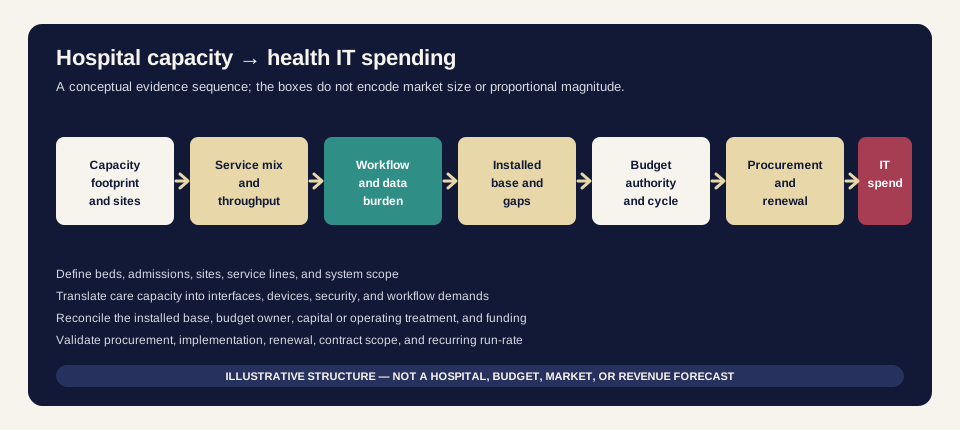
Conceptual capacity-to-spend flow for analysis only. The arrows show an evidence sequence; they do not show proportional magnitude or forecast confidence.
Scroll horizontally to compare all columns.
| Fictional decision gate | Illustrative input | What it can answer | What it cannot answer |
|---|---|---|---|
| Defined capacity cohort | 18 hospitals and 2,400 staffed beds in a fictional system | the facilities and capacity unit under review | actual occupancy, budget ownership, or vendor choice |
| Workflow translation | three new service lines and two cross-site data flows | the operational work that may create technology demand | whether a project is approved or funded |
| Installed-base gap | one aging interface layer and a fictional module gap | a possible replacement or expansion need | competitive win probability or contract value |
| Budget authority | system CIO owns core platforms; local sites own selected tools | who can approve and procure the work | available cash, timing, or final scope |
| Procurement event | a fictional renewal window in the next planning cycle | whether timing supports an active commercial motion | vendor selection, price, or implementation success |
| Validated spend endpoint | 3.2 fictional currency units of annual run-rate | a scenario for recurring technology value | a real budget, market size, or recognized revenue |
The fictional calculation would move from the defined cohort to workflow evidence, then apply an installed-base and authority filter before estimating any run-rate. It is intentionally not presented as a market result. A real bridge would replace each input with dated facility and system records, a measured workflow inventory, budget documents, procurement evidence, contract scope, and renewal or implementation timing.
The next research questions should be explicit: Which beds are staffed and in service? Which admissions, sites, and service lines create the relevant workflow? Which systems and interfaces are already deployed? Who owns the budget? What payment and margin conditions constrain funding? When is the next approved procurement or renewal event? Which vendor captures the work, under what contract, and with what recurring obligations? Answering those questions is how capacity data becomes a health IT spending analysis without pretending that beds are a budget.
Investigate the named change: a renewal, new workflow, cross-site interface or replacement constraint. Match it to the approving entity, funded scope and implementation calendar. That creates a useful account cohort for research and commercial planning while keeping national capacity statistics as context.
Discuss the evidence you need
Define the market, geography and questions your research must answer.
Sources
- AHA Fast Facts on U.S. Hospitals, 2025
- AHA Annual Survey 2024 questionnaire
- CMS Cost Reports and HCRIS
- CMS Hospital Provider Cost Report data
- CMS FY 2025 Hospital Inpatient Prospective Payment System
- CMS Hospital Outpatient Prospective Payment System
- ONC Non-Federal Acute Care Hospital EHR Adoption, 2008-2024
- ONC Hospital Use of APIs for EHR and Third-Party Data Sharing
- ONC Electronic Public Health Reporting Among Hospitals, 2024
- HHS Healthcare and Public Health Cybersecurity Performance Goals
- ONC Data Brief 71: Interoperable Exchange of Patient Health Information Among U.S. Hospitals — 2023 (published May 2024)