
A driver judges a charging site by whether a compatible port is available and the session works. A site investor also needs to know how much energy is sold and what remains after operating costs. Those decisions require an operating record, not just an inventory of equipment.
This article explains how to compare sites using port availability, completed sessions, delivered energy and queues. It keeps public, workplace and depot settings distinct and relates the measures to the site's ownership model. Source evidence is bounded to 2025; the final example is a constructed operating scenario.
Define the operating asset and its status
Use the unit that the source actually counts. The Department of Energy Alternative Fuels Data Center (AFDC) charging-infrastructure report distinguishes station locations, EV charging ports, and connectors. A station location is a site at an address. A port is an outlet available to charge one vehicle at a time, even if the charging equipment has multiple connectors. A connector is the plug or interface offered by that port.
This hierarchy matters because a site can have two posts, three ports, and four connectors. A public directory may expose every connector while an infrastructure count uses ports. A network may report ports running its software while a government registry reports public and private locations. A developer who adds these numbers together can create a fictional supply increase before any driver has access to a new charging position.
Record station ID, port ID, connector type, access class, charging level, rated power, network owner, operator, and reporting date. Keep a stable port identifier when a connector is replaced or a station moves between networks. If the source has only a station count, do not infer a port count. If it has only an equipment count, do not infer simultaneous charging capacity.
Treat installed inventory as a stock, not a usage measure
An installed-port series is a stock at a point in time. AFDC quarterly reports describe changes in the Station Locator and separate public from private non-residential infrastructure. They are useful for deployment, geography, access, and technology mix. They are not session logs. The Station Locator also does not maintain single-family residential charging data, so public and non-residential port counts cannot represent all charging capacity.
The IEA Global EV Outlook 2025 charging analysis makes the same distinction at a global level: public chargers can grow quickly while home charging remains the preferred option for drivers who have it. A market can add ports to improve coverage while average sessions per port fall because the new sites are early in their ramp or because a large share of drivers charge privately.
Use an inventory ledger with opening stock, additions, removals, temporarily unavailable ports, commissioned date, and access status. A planned port is not an operating port. An energized port that is still under acceptance testing is not equivalent to a port that can reliably complete a paid session. When a source revises its registry, retain the revision date and the reason rather than treating the new count as a usage jump.
Availability and utilisation require different denominators
These terms answer different questions:
- Uptime: whether the port is online and able to dispense the required power under a specified rule.
- Availability: whether a driver can obtain a usable port at the needed place and time, including access, visibility, queue, reservation, and compatibility.
- Time utilization: the share of a chosen time denominator during which a port is occupied or actively delivering energy.
- Energy utilization: delivered kilowatt-hours divided by a defined power-and-time capacity or another stated energy denominator.
- Throughput: completed sessions, kilowatt-hours, or revenue processed in a period.
The NREL EV-ChART data guidance defines uptime around hardware and software being online and the port successfully dispensing electricity at the required minimum power. It also separates total outage from excluded outage and excludes hours outside the station's stated operating hours in the federal formula. That is a reliability measure, not a demand measure.
The Joint Office reliability webinar describes the 97% uptime baseline and warns that overall availability is a complementary metric. A port can be up but occupied, restricted to employees, incompatible with the arriving vehicle, hidden by a payment failure, or behind a queue. Conversely, a lightly used port can have high uptime and low utilization. Never substitute one percentage for another.
Choose the denominator before calculating a rate
Utilization has no meaning until its denominator is named. Common choices include:
occupied hours ÷ calendar hours
energy delivered ÷ (rated kW × open hours)
completed sessions ÷ available port-days
revenue-producing sessions ÷ eligible sessions
Each rate answers a different decision. A 24-hour highway site may use calendar hours, while a workplace site may use scheduled open hours. A shared DC charger may have a 350 kW nameplate but deliver less because the vehicle accepts less power or the site shares power across stalls. A fleet depot can schedule every port for a short window and appear highly utilized on a shift basis while remaining idle overnight.
State the denominator beside the rate, along with whether the numerator includes failed attempts, free sessions, roaming sessions, reservations, or charging that stops before the vehicle disconnects. A network average should be weighted by the chosen denominator, not by a simple average of site percentages. A small, busy site and a large, quiet site should not receive the same influence unless that is the intended decision rule.
Use a measurement ledger before comparing sites:
Scroll horizontally to compare all columns.
| Utilization measure | Numerator | Denominator | Decision use |
|---|---|---|---|
| Installed stock | commissioned ports in the defined cohort | reporting date | capacity and coverage inventory |
| Operational port-hours | hours the port meets the stated uptime rule | open hours or calendar hours | eligible capacity |
| Uptime | minutes able to dispense required power | defined reporting minutes | reliability and service-level compliance |
| Session starts | authenticated attempts that begin | available port-hours or port-days | demand and funnel entry |
| Completed sessions | sessions that deliver energy and close | eligible starts or available port-days | conversion and customer throughput |
| Energy utilization | delivered kWh | rated kW × eligible hours or another stated energy capacity | power and energy planning |
| Commercial capture | charging, network, or subscription revenue | eligible sessions, kWh, or port-months | ownership and return analysis |
The rows are related, but they are not interchangeable. A site can add installed stock without adding operational port-hours. It can improve uptime without increasing sessions. It can raise energy utilization through higher-power vehicles while session count stays flat. Name the row that answers the buyer's question and preserve the others as evidence.
Sessions, delivered energy and the site catchment
A session count is a useful demand signal, but it is not a throughput or margin forecast. Session length, delivered power, vehicle acceptance, battery state of charge, idle time, tariff, discounts, roaming fees, and payment success determine the result. A Level 2 workplace session can occupy a port for hours and deliver modest energy; a DC fast session can deliver more energy in less time but face a different demand charge and maintenance profile.
EVgo's 2024 Form 10-K defines DC stalls as energized, inspected and commissioned units on its public network. An installed inventory and an operating stall population can therefore differ. Throughput and charging receipts require further period and customer evidence; a physical count alone does not prove utilization or profitability.
Build a session-to-energy ledger with session start, session end, delivered kWh, peak kW, average kW, tariff, customer type, payment route, and completion status. Reconcile the meter to the driver transaction when possible. If a network reports sessions but not kWh, keep the session series and leave energy throughput unavailable. Do not multiply sessions by the maximum charger power unless the source supports the actual delivery profile.
Match location and access to the demand pool
The same number of ports can have very different utilization because of where they are located and who can use them. A public corridor site depends on route traffic, travel time, amenities, vehicle range, and competing sites. A workplace site depends on employee schedules and parking duration. A multifamily site depends on assigned spaces and resident access. A depot depends on fleet dispatch and return-to-base timing. A home port is usually unavailable to the wider driver population.
AFDC classifies workplace and commercial or fleet infrastructure as private in the Station Locator. The IEA Global EV Outlook 2025 charging analysis estimates a very large global private charging stock and expects home charging to remain important. Those sources make the denominator problem visible: public-port growth does not equal total charging use, and private access can shift public sessions without any public port being removed.
Segment by access, site purpose, geography, hours, vehicle population, and competing supply. A network-wide average that mixes home-adjacent workplace ports with high-power highway ports hides the decision a site host needs to make. For a public investment, the relevant question may be peak-hour waiting probability. For a depot, it may be energy delivered per shift and the cost of reserved capacity.
Power delivery and the session experience
Nameplate power is a ceiling, not an energy outcome. EVgo explains that DC fast chargers can supply at least 50 kW, while actual charge rate is capped by both the charger profile and the vehicle's charging capability. Battery temperature, state of charge, voltage, cable sharing, transformer limits, and site-level power management can reduce the delivered rate.
Create power bands and record both rated and observed delivery. A 150 kW port serving an older vehicle may deliver less than a 50 kW port serving a vehicle that can hold its peak longer. A site with four high-power ports may have a shared transformer that prevents all four from drawing their nameplate simultaneously. The installed count is unchanged when the operator changes the power-sharing rule; the available throughput is not.
Use observed kWh, peak kW, and session curves when evaluating expansion. If only rated power is known, present a capacity scenario and mark utilization as unverified. Avoid comparing a Level 2 port-day with a DC fast port-day as if they offered the same service capacity. The unit of capacity must match the buyer's decision.
Measure the session lifecycle and failed attempts
The visible session count often begins too late. A driver may search for a port, see a stale status, arrive, authenticate, fail to start, retry through roaming, start a session, stop early, and leave the vehicle connected after energy delivery ends. Each event affects user experience and economics, but only some systems record the full sequence.
Use a funnel:
discoveries → arrival attempts → authentications → starts → successful energy delivery → completed sessions → paid settlements.
NREL's EV-ChART guidance is designed around session-level and port-level data so agencies can analyze congestion, utilization, reliability, and grid impact. Preserve failed starts and abandoned attempts as their own states. Removing them can make a weak site look busy because the denominator contains only successful sessions. A payment retry should not be counted as two charging sessions if the same energy delivery produced one settlement.
Reconcile network, roaming, and meter identifiers. If the same session is visible to a host, a charging network, and an e-mobility service provider, assign one owner for counting and document the joins. A clean-looking total with duplicate roaming records is less useful than a smaller total with an explicit coverage gap.
Queues, dwell and distinct site cohorts
Utilization can rise for two opposite reasons: a site has healthy demand, or drivers are blocked by long dwell and queues. The buyer needs both throughput and service quality. A port occupied after charging stops may show high time utilization while delivering no additional energy. A fast port with a short session may show lower occupied hours while serving more vehicles per day.
Track arrival time, queue entry, start time, energy-delivery end, connector release, and departure where the system can observe them. Calculate waiting probability, queue length, abandoned arrivals, and energy delivered per occupied hour. A site can have high energy throughput and poor availability during a narrow peak; a second site may have lower daily utilization but remove the peak queue and improve network coverage.
The Joint Office distinguishes the uptime baseline from overall availability for this reason. A port that is operational but occupied is not an outage. A port that is technically free but inaccessible to a vehicle class or payment method is not a successful customer experience. Keep service-level metrics beside utilization rather than hiding them in a single blended score.
Separate public, workplace, depot, and home cohorts
Do not use one utilization curve for every port type. Public fast charging is shaped by trip decisions and route alternatives. Workplace charging is shaped by arrival peaks and long parking. Depot charging is shaped by dispatch, return times, and fleet duty cycles. Residential charging is shaped by household access, tariffs, and overnight dwell. A new cohort can reduce the network average while increasing useful capacity for the target customer.
The IEA's 2025 analysis notes that public charging supports drivers without home access and long-distance travel, while private charging remains important. AFDC's public-versus-private classification and its exclusion of most single-family residential data mean a public registry cannot answer every home-charging question. Keep cohort labels in the source row, even if the dashboard later rolls them up.
For a fleet buyer, measure energy delivered per vehicle shift, port reservation adherence, and missed dispatches. For a retail host, measure sessions by daypart, dwell after charge completion, revenue per open hour, and nearby substitution. For a municipality, measure coverage, peak availability, equity of access, and reliability. The same port count can be sufficient for one buyer and inadequate for another.
Connectivity, ramp and the ownership model
An installed port can be physically present but commercially disconnected. Network software, cellular service, firmware, payment processing, roaming agreements, driver authentication, and map availability determine whether a driver can find and use it. A host-owned port may generate network fees even when a separate operator collects the charging payment. A roaming session can appear in more than one platform's usage report.
ChargePoint's 2025 Form 10-K distinguishes “active” ports running its software from ports reachable through roaming relationships. It also states that charging-session and transaction revenue are recognized when the session or transaction is completed, while subscriptions are generally recognized over time. Those are different populations and accounting events. They cannot be substituted for an installed-port count.
Record network status, last heartbeat, app visibility, authorization path, roaming flag, tariff, and payment outcome. If the business case depends on a roaming partner, identify the partner's coverage and settlement rule. If a port is free or subsidized, record the value transfer instead of assuming zero economics. Utilization is a behavior measure; connectivity is an enabling condition; revenue recognition is a reporting endpoint.
Adjust for ramp, seasonality, and cohort age
New ports are rarely mature on the day they are energized. The site may be waiting for signs, map inclusion, commissioning, fleet enrollment, or local awareness. A corridor site can be busy during holidays and quiet on ordinary weekdays. Weather, school calendars, fuel prices, incentives, construction, and vehicle mix change session demand without changing the installed stock.
Build cohort curves by commissioned month, site type, access, power band, and geography. Separate a port's first full operating month from its construction or acceptance period. Report median and percentile utilization as well as a network mean. If the source changes the definition of “active,” restate the historical series or label the break.
ChargePoint reports that its active-port and driver populations are defined by its software and that charging activity can be exposed through platform, subscription, and transaction measures. Blink's 2024 Form 10-K connects charging-service revenue to charger utilization and the number of chargers on its network while separately discussing product, network-fee, and host-owned arrangements. The filings show why a simple installed-base growth rate cannot explain operating performance.
Do not equate utilization with operator revenue
Revenue depends on the commercial model. A site host may receive a share of charging fees, a network fee, a fixed lease, a subscription, a grant, or a demand-response payment. An operator may own the hardware but outsource installation and maintenance. A charging network may recognize a transaction fee while an OEM or fleet contract pays for credits or availability. Energy throughput can rise while margin falls because electricity, demand charges, revenue share, maintenance, or payment losses rise faster.
EVgo separates charging-network revenue, OEM revenue, construction and operating-maintenance work, ancillary contracts, and utilization fees. ChargePoint separates networked hardware, subscriptions, and other charging-related fees. Blink separates product, charging service, network fee, and warranty revenue. Keep these endpoints separate in a supplier or site-host model.
The relevant financial bridge is:
eligible ports × available hours × sessions per available hour × kWh per session × realized price per kWh
Then subtract electricity, demand charges, host share, network fees, maintenance, payment cost, and capital recovery under the chosen ownership model. If any term is missing, show a range or leave the financial endpoint unavailable. Never present a port count as a revenue forecast.
Evaluate a site using a worked operating record
For a charging operator, investor, or site host, test the opportunity in six stages:
- Inventory boundary: identify ports, connectors, stations, access class, and commissioning status without double counting roaming or replacement equipment.
- Operational eligibility: confirm hours, uptime, network connectivity, payment path, maintenance coverage, and whether the port can deliver the required minimum power.
- Demand pool: define vehicle class, trip purpose, fleet schedule, nearby EV stock, home-charging access, competing ports, and daypart.
- Capacity and experience: measure rated and observed power, energy per session, queue, dwell, compatibility, failed starts, and waiting probability.
- Commercial endpoint: identify tariff, discounts, roaming settlement, host share, subscriptions, grants, credits, and revenue-recognition rule.
- Decision threshold: choose the metric that governs the purchase: peak availability, energy per port-day, sessions per port-month, gross margin, or cost per delivered kWh.
The output should be a cohort case with explicit unavailable fields. “The region has 20,000 ports” is a coverage statement. “The target sites can deliver 18 MWh per day at the 95th-percentile arrival window with a 97% uptime baseline and a defined host share” is an operating hypothesis that can be tested.
Test a fictional port-to-utilization bridge
The following bridge is deliberately fictional. It demonstrates the calculation structure and does not represent a station, network, utilization benchmark, market share, revenue forecast, or recommended purchase. Each input is invented solely to show how a buyer can separate installed ports, availability, sessions, throughput, and economics.
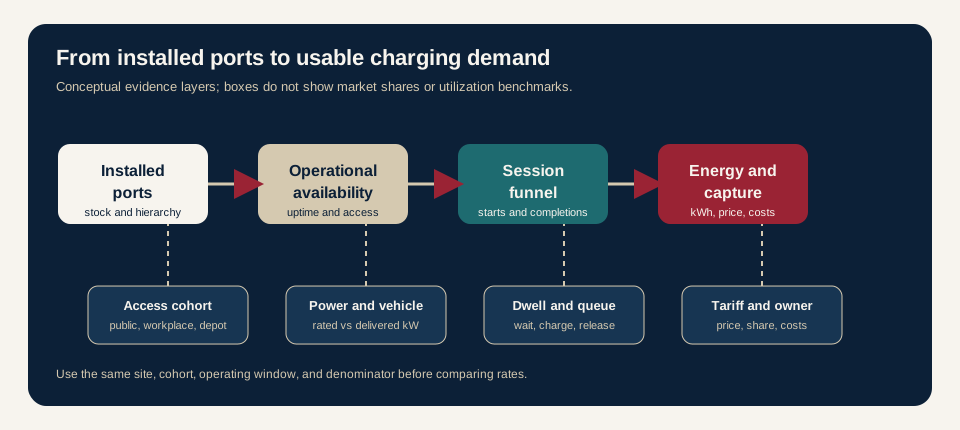
Conceptual port-to-utilization flow for analysis only. The arrows show an evidence sequence; they do not show a proportional share or forecast.
Scroll horizontally to compare all columns.
| Fictional bridge step | Illustrative input | What it can answer | What it cannot answer |
|---|---|---|---|
| Installed inventory | 80 ports at four sites | the defined physical stock | whether the ports are commissioned or accessible |
| Operational availability | 74 ports, 97% uptime, stated open hours | the eligible port-hours under the chosen rule | demand, queue, compatibility, or payment success |
| Session funnel | 1,850 starts; 1,620 completed energy sessions | conversion and failed-attempt questions | energy delivered or customer value |
| Delivered throughput | 28,400 kWh and 17.5 kWh per completed session | energy and session mix under the period definition | margin, peak load, or future demand |
| Congestion and dwell | 11% of occupied hours after energy delivery | idle-capacity and queue-management questions | why drivers stayed, unless event data explains it |
| Commercial capture | 0.31 currency units per kWh before site costs | a gross charging-revenue scenario | host share, energy cost, demand charges, or recurring fees |
The fictional inputs are intentionally simple. A real bridge would replace each one with a dated port registry, uptime and outage log, session record, meter reading, queue or dwell event, tariff, payment and roaming rule, and ownership contract. It would also separate public, workplace, depot, and private cohorts and state whether the denominator is calendar time, open time, or available port-hours.
Turn evidence gaps into research questions
Translate each unknown into a question tied to a decision:
- Inventory gap → Is the count a station, port, connector, software-managed port, or accessible roaming endpoint, and what is the as-of date?
- Availability gap → Is the port open, visible, compatible, and reservable during the target arrival window, or only technically online?
- Utilization gap → Does the numerator contain sessions, occupied minutes, delivered kWh, or revenue, and what denominator is applied?
- Power gap → What power did vehicles actually receive after vehicle limits, load sharing, temperature, and battery state of charge?
- Experience gap → How many arrivals waited, abandoned, failed authentication, or remained connected after energy delivery?
- Economics gap → Who owns the equipment, pays the electricity and demand charges, receives the tariff, and recognizes the transaction or subscription?
The strongest question is falsifiable and scoped. “How many charging ports does the market need?” is too broad. “For the target site's weekday 5–8 p.m. window, how many compatible ports can deliver the required power, how many arrivals complete sessions without a queue, and what contribution margin remains after energy and host costs?” identifies a site, cohort, time window, service level, and evidence owner.
A busy site can need more usable capacity, better session reliability or less idle dwell; those interventions solve different problems. Review the arrival window, completed energy sessions and customer waiting experience together. Then test contribution under the actual electricity tariff and host contract before deciding to add ports.
Discuss the evidence you need
Define the market, geography and questions your research must answer.
Sources
- AFDC: Electric Vehicle Charging Infrastructure Trends, Q2 2024
- NREL: EV-ChART Data Format and Preparation Guidance, Version 2.0
- IEA: Global EV Outlook 2025 — Electric vehicle charging
- Joint Office: Reliability Strategies for Electric Vehicle Charging
- EVgo: 10-K for the year ended 2024-12-31 (filed 2025-03-06)
- ChargePoint: 10-K for the year ended 2025-01-31 (filed 2025-03-28)
- Blink Charging: 10-K for the year ended 2024-12-31 (filed 2025-04-09)