
The commercially relevant unit in a pharma pipeline is an asset in a particular indication. One molecule can appear in several trials, treatment lines and geographies, each with different evidence and eligible patients. Portfolio counts are useful for describing development activity; assessing a launch opportunity requires following a specific indication into the care pathway.
This article explains how to build that patient funnel and connect it to development, access and delivery constraints. It is commercial research guidance using sources available by December 2025, rather than a treatment recommendation or a forecast of regulatory success.
Construct an asset-and-indication inventory
Pipeline sources use “asset,” “program,” “drug,” “molecule,” “study,” “indication,” and “trial” as if they were interchangeable. They are not. A single molecule can be studied in several indications. One indication can have several trials. A sponsor can count a partnered asset once in a company portfolio and again in a disease-area table. A registry record can describe a study rather than a unique product.
Write the counting rule beside every extracted number. A defensible record identifies the sponsor, asset or intervention, indication, trial identifier, development phase, geography, source date, and whether the record represents a unique asset or a study. If a source supplies only a study count, label it as a study count. Do not convert study count into pipeline depth by assuming one study equals one commercial product.
The FDA drug-development process separates discovery, preclinical research, clinical research, FDA review, and post-market safety monitoring. That sequence is a reminder that an early research record and a marketed indication sit on different sides of multiple gates. The inventory boundary must remain visible before any demand calculation begins.
Separate asset, indication, study, and label
An asset is the candidate or product. An indication is the disease, condition, line of therapy, biomarker group, or use being evaluated. A study is a protocol and its observed participants. A label is the approved use and conditions under which the product may be marketed in a jurisdiction. The same asset can have a large pipeline footprint while only one indication is commercially relevant to a buyer.
Use a many-to-many structure instead of flattening the records. Give the asset a stable identifier, then connect it to indication, trial, sponsor, partner, formulation, route, and jurisdiction. Keep an indication-level row for each distinct clinical question. If a source says “oncology pipeline” without naming the disease or population, preserve the broad label and mark the addressable population as unresolved.
The ClinicalTrials.gov protocol definitions define a study record, its overall recruitment status, and its phase as separate data elements. That distinction makes a useful data rule: registry rows are evidence about a study record and its reported status, not proof of a unique commercial opportunity. Deduplicate by asset and indication only after checking aliases, sponsors, intervention names, and trial identifiers.
Read phase and status as conditional evidence
Phase is a development stage, not a probability-adjusted forecast. Early-phase work can establish safety, dosage, or an initial biological signal. Later phases can test treatment benefit in a defined population, but a late-stage program can still fail, be delayed, change its endpoint, or narrow its intended label. A phase label says where the evidence process is reported to be; it does not guarantee the next gate.
Status requires the same care. “Recruiting” describes participant enrollment at the study level. “Active, not recruiting” means a study continues without enrolling new participants. “Completed” describes the study, not the approval or launch of the product. A sponsor can pause one trial while another continues, and a program can be deprioritized even when its registry record remains open.
The FDA clinical research overview explains that phases answer different questions and that protocols specify participants, duration, controls, dosing, assessments, and analysis. Use those fields to grade evidence. A count of early studies can support a signal of research activity; it cannot support a patient forecast unless the indication, design, enrollment, and expected use are also known.
Build the patient denominator
Demand begins with a population definition, not a pipeline total. Start with the condition and geography, then state whether the denominator is prevalence, incidence, diagnosed patients, treated patients, or people eligible for a specific line of therapy. These are different populations with different time bases. A chronic condition can have a large prevalence pool but a smaller annual treatment start pool.
The denominator should carry age, severity, biomarker, prior treatment, comorbidity, contraindication, and care-setting fields when they affect eligibility. If a trial enrolls patients who failed a prior regimen, do not compare its count with all diagnosed patients. If a gene therapy requires a confirmatory test, the testable population is a separate filter. If the source gives a broad disease count, label the narrowing steps as assumptions or missing evidence.
A useful population bridge is: condition population × diagnosed share × clinically eligible share × treatment-seeking share × reachable care share. The multiplication is a model structure, not a permission to insert generic rates. Every factor needs a source, a documented assumption, or an explicit unavailable state. Without that ledger, a pipeline count can be multiplied by an unqualified disease statistic and presented as demand.
Distinguish disease burden from eligible demand
Disease burden explains why a condition matters. Eligible demand explains who could receive the defined product during the defined period. Between the two sit diagnosis, clinical guidelines, line of therapy, contraindications, biomarker testing, physician choice, patient preference, and the availability of a treatment setting.
For a rare disease, the addressable pool may be constrained by diagnostic delay, specialist concentration, testing capacity, and referral pathways. For a chronic disease, persistence and switching can matter more than new diagnosis. For an acute treatment, the commercial event may be an episode, admission, or test-positive patient rather than the total people living with the condition. A single “patient population” column hides these differences.
Mark each filter as observed, modeled, or unresolved. Observed means the source directly reports the field for the chosen population and period. Modeled means the calculation uses a stated assumption. Unresolved means the evidence is not sufficient. Keep unresolved filters out of a headline demand value; show them as a range request or as a reason the opportunity remains conditional.
Development, label and access gates
Regulatory approval narrows the use case. The FDA review process evaluates whether submitted evidence supports safety and effectiveness for the intended use and proposed labeling. The Drugs@FDA database contains approved-product information, labels, approval letters, and reviews for much of the United States product history. Those resources can verify an approved indication; they cannot turn an investigational indication into an approved market.
Keep three states separate: investigational use, regulatory submission or review, and approved use. A press release about a positive trial result is not a label. A filing is not an approval. An approved product may still have a narrower population, dosing condition, companion-diagnostic requirement, or safety restriction than the pipeline description suggests.
For cross-border work, preserve the jurisdiction. The EMA evaluation description shows that assessment considers the proposed patient group, unmet need, quality, benefits, side effects, risk management, and follow-up evidence. A US approval, an EU authorisation, and a local reimbursement decision are separate events. Do not use one as a proxy for global access.
Treat approval as a gate, not a demand forecast
An approval creates a legal and clinical-use opportunity under a defined label. It does not reveal the number of prescriptions, the speed of adoption, the payer mix, or the share captured by the sponsor. Those outcomes depend on treatment guidelines, competitor availability, prescriber confidence, supply, price, patient support, and reimbursement.
Accelerated pathways make the distinction especially important. The FDA Accelerated Approval Program allows approval using a surrogate endpoint for serious conditions and requires confirmatory evidence of clinical benefit. An indication can therefore be available while important evidence remains in progress. Record the approval pathway, confirmatory-study status, restrictions, and withdrawal risk beside the label.
Do not apply a single phase-to-sales conversion to every therapeutic area. The evidence burden, natural history, endpoint, comparator, trial duration, and standard of care vary by indication. A probability-of-technical-and-regulatory-success model can be useful for an internal decision, but its inputs are not patient demand. Keep risk adjustment separate from the population bridge and label it as a valuation or prioritization layer.
Map reimbursement and health technology access
Regulatory permission and payer access are different gates. The CMS formulary guidance describes Medicare prescription-drug coverage policies and formulary-file requirements. A product can be approved yet face a formulary tier, prior-authorization rule, step-therapy condition, or population restriction that changes reachable demand.
Health-technology assessment adds another evidence and budget decision. NICE describes evaluations that produce recommendations on new and existing medicines and other health technologies. The relevant output is not a generic “market access” score; it is a recommendation, restriction, comparator, eligible population, evidence uncertainty, and implementation setting for the jurisdiction being modeled.
Build an access ledger with regulator, payer or HTA body, decision date, covered population, restriction, evidence requirement, price basis, and care setting. If no payer decision is available, say coverage is unverified. Do not infer coverage from regulatory approval or from a company’s list price. A pipeline with a large eligible population can have limited near-term demand when the care pathway cannot fund or deliver it.
Treatment choice and delivery capacity
A pipeline candidate does not enter an empty market. It may compete with a generic, a biosimilar, a standard of care, a procedure, a watch-and-wait approach, or another pipeline asset that reaches the same patients earlier. Its realistic demand depends on the line of therapy, comparator, clinical differentiation, dosing burden, safety profile, and switching friction.
Map competition at the indication level. Identify the incumbent treatment, its place in therapy, the candidate's proposed place, and any overlapping trials or approved labels. If an asset is intended for patients who have exhausted several therapies, its eligible population may be small even when disease prevalence is high. If it moves into earlier treatment, the pool may be larger but the evidentiary and competitive bar may also rise.
Avoid double counting across a crowded pipeline. Two assets pursuing the same biomarker group do not create two independent patient pools. They create competing claims on one pool, subject to trial success, launch timing, treatment sequencing, and differentiation. A competitive map should show overlap and substitution before a demand value is assigned.
Model geography, diagnosis, and delivery capacity
The same asset can have different addressable demand by country because diagnosis, clinical practice, regulatory timing, reimbursement, distribution, and treatment capacity differ. A global pipeline count is therefore a portfolio signal, not a global revenue denominator. Choose a geography and keep the population, payer, currency, and date aligned.
Delivery constraints can be material. A cell or gene therapy may require a qualified center, cold-chain logistics, apheresis, manufacturing slots, or a long observation period. An infused biologic may depend on chair capacity and trained staff. An oral therapy may depend on specialty-pharmacy distribution, monitoring, or patient support. These are commercial filters, not implementation details to be added after the market estimate.
Use a geography-and-capacity row that records launch status, eligible centers, referral path, diagnostic availability, manufacturing or supply limit, and expected treatment cadence. When those fields are missing, preserve the gap. A patient can be clinically eligible and still not be reachable in the period being forecast.
Patient volume, net value and the portfolio ledger
Patient opportunity, treatment volume, and revenue answer different questions. A patient may receive multiple units, cycles, or doses. A treatment may be discontinued, delayed, or supplied under a different contract. Gross list price is not net realized price after rebates, discounts, patient assistance, mandatory discounts, distribution fees, and returns.
Use separate identities:
Eligible patients × treated share × treatment units per patient = treatment volume.
Treatment volume × net realized price = product revenue.
Product revenue × relevant supplier or channel share = addressable revenue for the chosen participant.
These identities are only valid when the period, geography, product form, and recognition boundary match. If a buyer sells clinical-trial services, manufacturing, diagnostics, or market-access support, its opportunity is not the sponsor's product revenue. Link the asset demand to the buyer's actual offer and contract boundary.
Use the pipeline ledger before ranking assets
Before ranking a pipeline, create a ledger that records the evidence and the unresolved fields. The following structure keeps the inventory signal separate from demand evidence:
Scroll horizontally to compare all columns.
| Pipeline measure | What it measures | Decision use | Common misread |
|---|---|---|---|
| Unique asset | Candidate or marketed product identity | Deduplicate the portfolio | Counting every study as a product |
| Indication | Disease, population, line, or biomarker use | Define the patient question | Treating a broad therapy area as an eligible pool |
| Study phase | Development stage and evidence purpose | Stage the next gate | Treating phase as a sales probability |
| Recruitment status | Study enrollment condition | Judge operational evidence | Calling a completed or recruiting study an approval |
| Regulatory state | Submission, review, approval, or withdrawal | Establish legal-use boundary | Assuming an announced filing is a label |
| Access decision | Formulary, HTA, restriction, or care setting | Estimate reachable demand | Equating approval with funded use |
| Commercial endpoint | Volume, price, service, or supplier capture | Match the buyer's decision | Calling patient count revenue |
Each row should retain source date, jurisdiction, source type, and confidence in the field—not a generic confidence badge. A program may have strong study evidence but no reimbursement decision. Another may have an approved label but a constrained care pathway. Ranking needs both the positive evidence and the missing gate.
Assess a defined asset using a patient-funnel scenario
The right filter depends on the decision. A biotech considering a licensing deal may need indication overlap, phase risk, differentiation, probability-adjusted launch timing, and net sales scenarios. A contract research organization may need trial starts, protocol complexity, eligible sites, enrollment friction, and outsourcing share. A manufacturer may need dose volume, modality, batch size, and capacity timing. A payer may need eligible population, comparative benefit, budget impact, and utilization management.
Use a buyer-specific bridge:
Defined indication population × eligible share × diagnosed and reachable share × treated share × competing-product adjustment × time-window share = addressable treatment events.
Then connect treatment events to the buyer's unit. For a supplier, use units per treatment and qualified share. For a service provider, use trials or sites that are outsourceable. For a market-access team, use decisions and covered lives. A pipeline count can inform the first screen; it cannot choose the endpoint for the buyer.
Test a fictional pipeline-to-demand bridge
The following bridge is deliberately fictional. It demonstrates the calculation structure and does not represent a drug, sponsor, indication, patient population, approval, market share, revenue forecast, or recommended investment. Every input is invented solely to show how a buyer can separate pipeline inventory, eligibility, access, competition, and commercial capture.
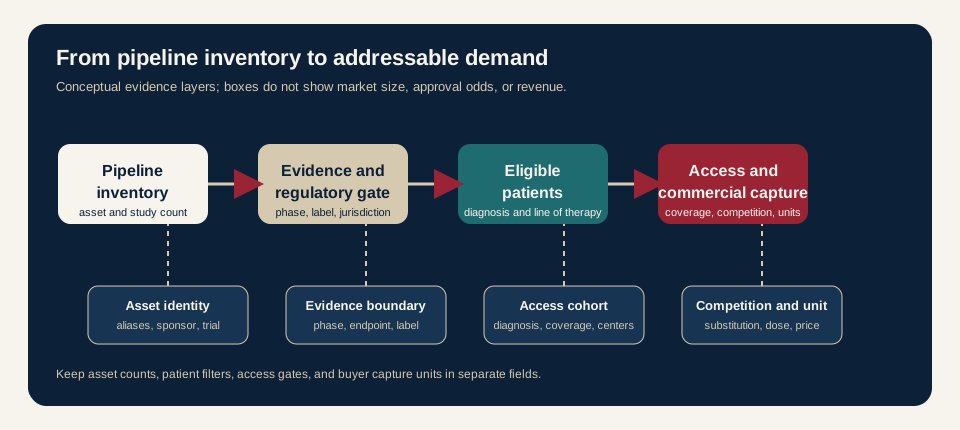
Conceptual pipeline-to-demand flow for analysis only. The arrows show an evidence sequence; they do not show proportional shares, approval odds, or a forecast.
Scroll horizontally to compare all columns.
| Fictional bridge step | Illustrative input | What it can answer | What it cannot answer |
|---|---|---|---|
| Asset and indication | 1 fictional asset in 2 defined indications | whether the portfolio is deduplicated at indication level | approval or launch timing |
| Defined population | 120,000 people in one fictional geography and year | the starting disease or treatment pool | diagnosis, eligibility, or payer access |
| Clinical eligibility | 35% after biomarker and line-of-therapy filters | a modeled eligible cohort | actual testing, guidelines, or physician choice |
| Reachable access | 60% after coverage and center-capacity filters | a conditional reachable pool | confirmed reimbursement or supply |
| Treated share | 25% after competition and adoption assumptions | a fictional treatment-event case | real uptake, persistence, or net price |
| Buyer capture | 1.4 units per event and a fictional supplier share | a unit and capture scenario | company revenue, margin, or market share |
The arithmetic is intentionally transparent: each factor is visible, and every factor would need evidence before a real forecast. If the coverage or capacity row is unavailable, the correct output is a conditional range or an evidence request. Replacing an unavailable factor with a round number would make the table look complete while weakening the decision.
Set update, uncertainty, and decision rules
Pipeline analysis decays quickly because trial status, sponsors, endpoints, labels, competitor programs, reimbursement, and supply plans change. Store a last-verified date for every material field. Recheck high-volatility fields after a milestone, safety signal, regulatory action, trial-status change, or payer decision. Preserve the original observation and the later revision so a reader can distinguish a changed fact from a changed method.
Use explicit decision rules. For example, advance an asset to a launch-demand model only when its indication, phase, jurisdiction, evidence status, regulatory path, eligible population, access path, and competitor set are documented. Keep it in a pipeline-monitoring view when one or more of those gates is unresolved. Stop a revenue estimate when the buyer's endpoint or contract boundary is unknown.
The commercial conclusion should be short and conditional: a pipeline count can show research activity and potential future options; addressable demand requires a defined indication, patient filters, evidence and regulatory status, access, competition, timing, and a buyer-specific capture rule. That discipline produces a smaller but more defensible opportunity set than multiplying every listed asset by a broad disease statistic.
For GIC readers, the next step is to define the asset universe, reconcile aliases and trial records, choose the indication and geography, collect the regulatory and access evidence, and only then size the buyer's endpoint. The pharma-biotech industry hub provides the relevant sector context, while the pharma commercial opportunity guide can organize a fuller pre-launch assessment. Neither destination turns an unresolved pipeline count into a published forecast.
Keep the indication-specific population and evidence beside every portfolio comparison. A promising development record may justify deeper work on diagnosis, eligible patients and the access route; it does not remove those constraints. Commission the missing patient or payer research for that indication before choosing a launch or investment assumption.
Discuss the evidence you need
Define the market, geography and questions your research must answer.
Sources
- FDA: The Drug Development Process
- FDA: Step 3 — Clinical Research
- FDA: Step 4 — FDA Drug Review
- ClinicalTrials.gov: Protocol Registration Data Element Definitions
- FDA: Accelerated Approval Program
- EMA: How EMA evaluates medicines for human use
- CMS: Formulary Guidance
- NICE: Introduction to health technology evaluation
- FDA: About Drugs@FDA