
A SaaS company can grow through more customers, additional billable users, a higher-priced package or greater consumption. It can also lose revenue when customers keep their accounts but reduce contracted seats. A useful growth analysis separates those changes instead of giving every reported user the same value.
Start with the customer contract: what is purchased, who can use it, how the charge is calculated and when the service is delivered. Then follow expansion, contraction and churn in comparable cohorts. The examples and issuer disclosures below explain how to construct that analysis using evidence available through 2025.
How seats enter a subscription contract
“Seats” can mean users entitled to a product, licenses purchased, accounts provisioned, users active during a period, or a denominator chosen for an operating metric. Those are related but different objects. A contract may cover 500 seats even if only 320 people log in during a month. A customer may purchase a 500-seat tier but pay a flat fee that does not change when activity is 320 or 480. Another product may charge for consumption on top of a seat entitlement.
Revenue has a different unit and time basis. It can be recognized per month as a subscription service is delivered, at a point in time for a distinct implementation service, or as usage occurs. A seat count is usually a point-in-time or period-average quantity. Multiplying it by a headline price without matching the contract and recognition period creates a number that looks precise but does not describe the supplier's reported revenue.
The first discipline is to label every metric with its object, date, and unit. Write “paid seats at 31 December,” “average billable seats in Q4,” “contracted seats in signed annual terms,” or “monthly active users” instead of a bare “seats.” Then state whether the target is billings, cash collected, recurring run rate, recognized subscription revenue, total revenue, or a market opportunity. The same seat record can feed several analyses, but it must not be silently reused as if all outputs were interchangeable.
Define the denominator before comparing companies
The organization, customer, user, and seat are different levels of observation. Box defines a paying organization as a distinct buying entity that has entered into a subscription agreement. It describes deployments ranging from small groups to thousands of user seats and says subscription fees depend on customer requirements, including users and functionality. This is evidence that a customer count and seat count sit in the same commercial system without being the same denominator.
Atlassian's Form 10-K for the year ended June 2025, filed in August 2025, defines total customers as organizations with unique domains and an active subscription for two or more seats. A customer count therefore depends on minimum seats, domain identity and paid-subscription status. It cannot be compared directly with a vendor that counts every registered workspace or individual account.
Before using a seat series, record at least these fields:
- Buying entity: company, business unit, school, public agency, or individual account.
- Entitlement: seats purchased, users licensed, seats available under a tier, or seats actually paid for.
- Activity rule: login, product event, assigned license, billable usage, or another definition.
- Access state: paid, trial, free, suspended, grace period, or cancelled.
- Observation date: end of month, average of daily snapshots, quarter end, or annual cohort.
- Product scope: one application, a bundle, a platform, or an entire customer relationship.
The denominator is part of the result. If a vendor includes a free plan in active users while another counts only paying seats, the apparent conversion from users to revenue will be biased before price is even considered. If an enterprise can assign one license to several people in shifts, a seat may also represent a contractual right rather than a unique human. Preserve those distinctions in the source record.
Separate contracted, provisioned, active, and billable seats
A seat moves through operational states. A signed order may establish a contractual maximum. An administrator may provision accounts below that maximum. A user may log in during the month. The billing system may apply a minimum commitment, a true-up, or a usage threshold. The finance ledger then recognizes revenue according to the service delivered and contract terms. Each state answers a different question.
Use the following sequence when building a seat bridge:
- Contracted seats are the entitlement or commitment in the agreement at the selected date.
- Provisioned seats are accounts or licenses assigned in the product or identity system.
- Active seats meet a stated activity rule during the period.
- Billable seats are the units used by the price schedule after minimums, caps, grace periods, and credits.
- Recognized subscription revenue is the amount allocated to the service delivered in the reporting period.
These sets overlap but are not nested in every contract. A minimum annual commitment can make billable seats exceed the number of active users. A true-up can make the billable amount change after a monthly snapshot. A flat enterprise agreement can make billable seats irrelevant to the invoice. A usage-priced product can have many provisioned users and little metered consumption. The model should retain the reconciliation rule instead of forcing every customer into one seat multiplier.
The time grain matters too. End-of-quarter seats can conceal a mid-quarter expansion or a short-lived seasonal deployment. A daily average can be more relevant for a usage charge, while a contract-end seat count may be the right input for an annual recurring metric. State whether the observation is a point, average, maximum, or cohort measure before interpreting growth.
Pricing, packaging and the service period
List price is not realized price. SaaS packaging can combine a per-seat fee with product tiers, minimum commitments, volume discounts, annual prepayment, implementation, premium support, or consumption charges. A bundle may include several applications where the customer never assigns every available seat. A company can also change the package while the number of seats remains unchanged.
Build a price waterfall that starts with the contractual list price and records each adjustment:
list price → tier or bundle allocation → volume discount → negotiated concession → credits or refunds → realized recurring price
Keep one-time and recurring amounts separate. Implementation, migration, training, and data conversion may appear on the same order as a subscription but follow a different delivery and revenue pattern. Taxes collected for a government authority are not supplier revenue. Marketplace or reseller arrangements may also change whether the supplier reports gross or net amounts for a transaction.
Customer mix changes the average even when every individual price is stable. A thousand small customers on monthly plans can produce a different realized price and renewal pattern from ten enterprises on multi-year agreements. Regional currencies, partner discounts, nonprofit terms, and product bundles add further variation. Report the distribution or segment averages when the decision depends on mix; do not hide a skewed population behind one average seat price.
Revenue recognition follows service delivery, not invoice size
The Financial Accounting Standards Board describes Topic 606 as a framework for reporting the nature, timing, and uncertainty of revenue from contracts with customers. The existence of a signed order is therefore not enough to determine the revenue recognized in a period. The contract's promised goods or services, allocation, delivery, and satisfaction of performance obligations matter.
Box's filing makes the practical distinction visible. It says customers are typically invoiced at the beginning of a term, while subscription and premier-services revenue is recognized ratably over the contract term. A customer can pay an annual invoice in January while the supplier recognizes roughly one month of subscription service in January and the remainder later. The billed amount, cash receipt, deferred revenue, and recognized revenue are different ledger events.
Remaining performance obligations add another layer. They represent contracted revenue that has not yet been recognized, including deferred and unbilled amounts in the company's stated scope. They can indicate future contracted service, but they are not current-period revenue and are not a guarantee of renewal beyond the contract. Use them to understand timing and backlog, never as a substitute for the revenue line.
A seat-based market model should therefore choose its accounting question explicitly. If the question is current recurring capacity, a contract-based ARR-style measure may be appropriate. If the question is reported annual revenue, use recognized revenue and reconcile the timing of starts, renewals, concessions, and performance obligations. If the question is cash or billings, model invoice cadence and collections. Mixing these outputs is one of the fastest ways to overstate a seat-driven opportunity.
Customer mix and cohort retention
The mean seats per customer can be misleading when the distribution is long-tailed. One enterprise deployment with 20,000 seats may outweigh thousands of small workspaces. The enterprise may have a negotiated bundle, dedicated support, and a slower renewal cycle. The small workspaces may be monthly, self-serve, and more sensitive to price or product limits. A market estimate should segment before calculating an average.
Useful segment fields include customer size, industry, geography, product tier, contract term, purchase channel, seat band, and implementation status. Preserve whether a seat belongs to a new logo, an expanding customer, a renewal, or a migration from another edition. These states affect both the amount and timing of revenue. A new customer can require onboarding work and higher acquisition cost, while an existing customer may add seats with little incremental selling expense.
Workiva's 2024 Form 10-K, filed in February 2025, describes more than 6,300 organizations using its platform and distinguishes subscription and support from professional-services revenue. The organization count does not reveal the number of seats, and the revenue categories do not reveal a common per-seat price. Preserve those definitions before constructing an account-to-revenue model.
For a buyer or investor, the practical output is a segmented bridge rather than a single seat-to-revenue ratio. Show the number of customers in each band, seats per customer, realized recurring price, contract term, renewal status, and non-seat revenue. This makes it possible to see whether growth comes from more customers, more seats inside existing customers, price, mix, or services.
Track expansion, contraction, and churn by cohort
Seat growth is not the same as revenue retention. A customer can add users at a lower tier, reduce users but accept a price increase, or keep the same seats while buying another module. Each event changes revenue differently. A cohort model keeps those movements visible.
For each customer cohort, start with the recurring value at the beginning of the period and bridge the changes:
ending recurring value = beginning value + new customers + expansion − contraction − churn + price or foreign-exchange effects
For a retention view, exclude new customers and compare the same starting cohort. Reconcile opening recurring contract value with churn, contraction, expansion and changes in price. A revenue-retention calculation is not a seat-retention calculation: the value of lost or added seats depends on the customers and contract terms involved. State the exact calculation rather than assuming every issuer reports the same metric.
Do not infer revenue retention from seat retention alone. If 100 seats become 90, the revenue effect depends on which customers lost seats, their prices, their discounts, and whether they also expanded another product. If seats rise 10% while revenue rises 3%, the change may reflect lower-priced mix, free or trial seats, reduced usage, concessions, or a shift from annual to monthly terms. The cohort bridge should identify the driver before assigning a commercial implication.
Keep win-backs and reactivations consistent. A customer that cancels and returns after a short period can be treated as a renewal or a new logo depending on the documented policy. Changing that rule between periods can make churn and expansion appear to improve without any change in customer behavior. Store the cohort definition alongside the metric.
Consumption pricing and recurring-revenue measures
Some SaaS products use seats as an access layer while charging for activity, storage, API calls, data processed, transactions, or compute. In those models, a seat count can describe the potential user base while consumption determines much of the revenue. A customer may provision many users for occasional use or a smaller specialist team that generates heavy usage.
Snowflake's fiscal 2025 Form 10-K explains that product revenue generally follows platform consumption. Contract duration alone does not establish when a customer consumes capacity. The filing separately discusses customer activity, net revenue retention and remaining performance obligations. These metrics answer different questions and should not be collapsed into a seat count.
For hybrid pricing, split the model into fixed and variable components:
subscription revenue = contracted access fee + included-seat component + metered usage + overage − credits and concessions
Record the usage unit, the billable interval, the minimum, the rate card, and any cap. A product analytics event is not automatically a billable unit; it may be sampled, rounded, bundled, or subject to a commitment. If overages are material, a seat-only forecast will usually understate volatility. If included usage is generous, a seat-only forecast may overstate monetization by treating every entitlement as paid activity.
Keep ARR, MRR, billings, and revenue in separate columns
Recurring metrics answer operating questions that accounting-period revenue does not answer directly. Build the annualized contract value from the eligible contract population and stated period; identify product, usage, service and cancellation treatment. Preserve the issuer's own definition when comparing public disclosures. An ARR-style run rate is neither recognized annual revenue nor an assurance that every account will renew.
Operating metrics such as MRR, ARR, churn, expansion, contraction, revenue retention and usage should remain separate inputs. Box's fiscal 2025 filing discusses seat-led expansion, customer retention and contract value, while Snowflake's filing describes consumption-driven revenue. Record the calculation rule and cohort boundary beside each measure, and document every normalization needed for comparison.
The minimum metric ledger should include:
- Seats: the stated entitlement or activity denominator and its date.
- MRR: the recurring run rate for the selected month under a documented rule.
- ARR: the annualized recurring value at a point in time under the issuer's definition.
- Billings: amounts invoiced in the period, including the company's stated treatment of deferred revenue and contract assets.
- Cash: collections, which can differ from invoices because of terms and arrears.
- GAAP revenue: recognized revenue for the reporting period.
- Remaining performance obligations: contracted value not yet recognized under the disclosure's scope.
Do not add ARR to recognized revenue or treat RPO as a market forecast. Do not compare one company's ARR to another's revenue until the definitions, contract scope, currency, period, and inclusion of services or maintenance are reconciled. When the definitions cannot be reconciled, preserve both series and mark the comparison unavailable.
A worked seat-to-revenue example
The chart below is an illustrative model, not a company benchmark. It assumes 1,000 contracted seats, an average of 820 billable seats after inactive or unused capacity, and a realized monthly price of USD 95 per billable seat. The resulting illustrative MRR is USD 77,900, calculated as 820 × USD 95. Annualizing that run rate would produce USD 934,800, but the model does not claim that all seats renew, that usage stays constant, or that GAAP revenue appears on the same schedule.
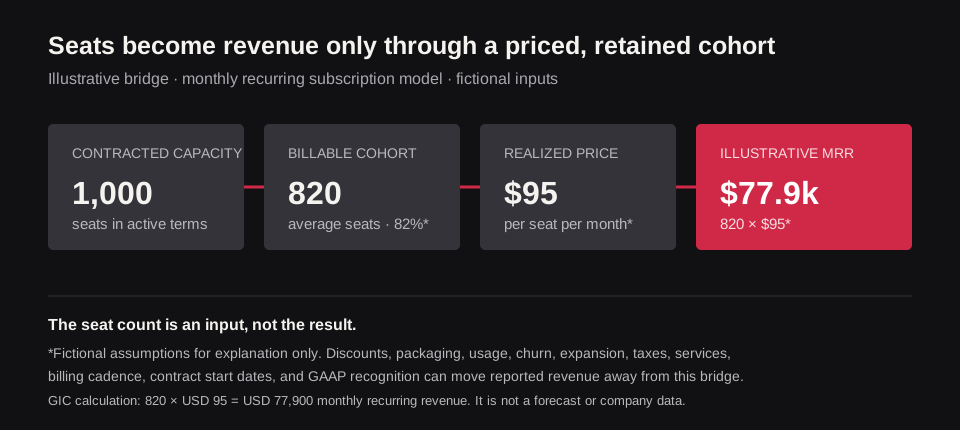
Illustrative seat-to-revenue bridge using fictional inputs. The values demonstrate the calculation and are not a forecast, public-company metric, or market estimate.
The sensitivity is more informative than the point estimate. If average billable seats fall to 600 with price unchanged, MRR becomes USD 57,000. If the seat count remains 820 but realized price falls to USD 75, MRR becomes USD 61,500. If usage-based overages add USD 10,000 in a strong month, the recurring access bridge and the variable revenue bridge should remain visible rather than silently changing the seat price.
The example also exposes timing. Suppose the contract is signed on 15 November and billed annually in advance. Billings can include the annual amount in November, cash may arrive under the customer's payment terms, deferred revenue records the unearned portion, and recognized subscription revenue follows service delivery. A seat count captured on 30 November cannot by itself settle any of those amounts.
Build an evidence bridge before sizing growth
The table identifies what reviewed evidence can support and what still needs customer, product, contract, or accounting data. “Available” describes the scope of the cited source; it does not mean the source answers every company's seat or revenue question.
Scroll horizontally to compare all columns.
| Metric layer | What reviewed evidence can show | What remains unknown | Correct role in the model |
|---|---|---|---|
| Customer and seat definition | Box and Atlassian disclose buying-entity and minimum-seat rules for their own products | Cross-company comparability, free accounts, shared access, and local active users | Establish the denominator and inclusion rule |
| Contracted terms | RPO and contract-term disclosures show signed value and expected recognition timing within the issuer's scope | Renewal probability, concessions, cancellations, and contract-level seat allocation | Separate committed future value from current revenue |
| Price and packaging | Filings describe subscription pricing drivers, tiers, bundles, and service categories | Realized price by seat band, discount waterfall, taxes, and partner economics | Convert billable seats into a price distribution |
| Usage and activity | Snowflake shows a consumption-based product-revenue model; operating metrics can expose activity | Billable events, included usage, overages, seasonality, and product engagement | Add variable revenue without relabelling seats |
| Billing and cash | Box explains invoicing cadence, deferred revenue, billings, and ratable subscription recognition | Collections, payment terms, credits, refunds, and customer-level aging | Reconcile invoices and cash to the service period |
| Recognized revenue | FASB Topic 606 provides the reporting framework; company notes show the issuer's application | Allocation across distinct obligations, start dates, and local accounting treatment | Use the correct period and revenue boundary |
| Retention and expansion | Matched issuer disclosures and a defined starting-customer cohort support a revenue-retention analysis | Cohort composition, seat-level movements, price effects, and win-back policy | Bridge recurring value of the starting cohort |
| Services and provider capture | Workiva and Box disclose subscription, support, and professional-service categories | Attach rate, pass-throughs, reseller share, and supplier-specific obtainable revenue | Keep non-seat revenue separate and avoid double counting |
The unavailable cells are the research agenda. A market analyst may need billing extracts, product telemetry, contract samples, cohort retention, pricing studies, and interviews with finance or procurement teams. A supplier opportunity model may additionally need target-account coverage, buying cycles, competitive displacement, implementation capacity, and the share of seats that can actually be won.
Choose the subscription and services boundary
An invoice can bundle software access with implementation, training, premium support, data conversion, payments, or third-party services. Box reports subscription, premier services, and professional services as distinct revenue sources. Workiva reports subscription and support alongside professional services. Those categories can have different delivery dates, margins, renewal behavior, and accounting treatment.
Do not treat every person touched by a project as a subscription seat. An implementation consultant may configure a system for 500 licensed users without creating 500 consulting units. A reseller may invoice the customer while the software supplier records a net amount. A payment processor or cloud host may earn a separate fee that belongs elsewhere in the value chain. Decide whether the analysis measures end-customer spending, supplier revenue, or value added at one layer.
For a market-sizing exercise, define the boundary in a sentence: “annual recognized subscription revenue for cloud software access, excluding implementation, taxes, reseller margin, and metered third-party services.” If the decision is about total customer budget, use a broader boundary and show its components. Either choice can be valid; the error is switching boundaries when the seat count reaches the final slide.
Build a cohort model that can be audited
The smallest useful customer-level extract has one row per account and period with customer ID, buying entity, product, contracted seats, provisioned seats, active seats, billable seats, list price, realized price, contract start and end dates, billing cadence, discounts, usage, recognized subscription revenue, services revenue, churn or downgrade event, and source timestamp. Keep personally identifiable user data out of the analytical extract unless it is necessary and authorized; aggregate to the customer or seat band where possible.
Calculate the bridge in the same currency and period. For monthly analysis, do not combine a month-end seat count with a quarterly revenue total without a documented conversion. For annual analysis, decide whether a seat represents a point-in-time entitlement, an average of monthly observations, or a cohort that entered during the year. Preserve fiscal-year boundaries and foreign-exchange treatment.
Run three reconciliations:
- Operational reconciliation: contracted seats, provisioned seats, activity, and billable units agree with product and billing systems.
- Commercial reconciliation: price, discounts, minimums, expansion, contraction, and churn tie to contract events and invoices.
- Financial reconciliation: billings, deferred revenue, RPO, services, and recognized revenue tie to the reporting period and disclosed accounting policy.
Flag unresolved differences rather than forcing a plug. A small unexplained gap may be a rounding or timing issue; a large gap can indicate duplicate accounts, a reseller boundary, a missing product, a contract modification, or a definition change. Record the impact on the decision so a buyer can see whether the conclusion is robust to the missing field.
Questions for the buyer and finance team
For a software operator, ask which seat bands generate durable expansion, which accounts are underused, and whether pricing or packaging changes would alter retention. For an investor, ask how the issuer defines its metrics, how ARR relates to revenue, and which portion of growth comes from new customers, seats, price, usage, or acquisitions. For a market analyst, ask whether the target is customer spend, supplier revenue, active demand, or an obtainable segment.
The brief should request:
- the exact seat and customer definitions, including free, trial, suspended, and shared accounts;
- a periodized cohort of contracted, active, and billable seats;
- price and packaging by segment, with discounts and credits identified;
- usage and overage units where the contract is hybrid or consumption based;
- churn, contraction, expansion, renewal, and win-back rules;
- a reconciliation from invoices and cash to deferred and recognized revenue;
- services, support, reseller, tax, and pass-through boundaries; and
- the decision threshold that would change the recommendation.
Stop or rescope when a proposed estimate multiplies total users by list price, treats ARR as a forecast, adds RPO to current revenue, uses a different company's NRR definition without adjustment, or counts professional services and subscription access as one seat pool. A focused study of pricing, cohort retention, or contract terms can be more decision-useful than a broad SaaS market total that never explains the seat-to-revenue bridge.
Use the software and cloud research hub to frame the sector, the research scope worksheet to specify the metric boundary, or scope custom research when the necessary customer, pricing, usage, or contract evidence is not public.
For an account-level forecast, reconcile opening contracts, new customers, expansion, contraction and churn before applying the pricing and recognition rules. Where comparable billable-seat data is unavailable, retain the issuer's own revenue measure and its definition. The useful comparison is a supported growth explanation, with the assumptions that would change it made explicit.
Discuss the evidence you need
Define the market, geography and questions your research must answer.